Introduction
This investment analysis report evaluates the decision to invest $100,000 in Tesla’s common stock (TSLA) or to keep it in a high-yield savings account with a consistent annual interest rate of 5%. The analysis is contextualized by the financial status of an investor who is 25 years away from retirement, earns income that exceeds their daily expenses, and holds a diverse investment portfolio. The investor’s portfolio is diversified among the S&P 500 index, a medium-duration, high-quality bond fund, and a savings account, collectively representing a liquid net worth of $1,000,000. The primary aim of this report is to determine which investment option—Tesla’s high-risk, high-potential-return stock or a stable bank account—would most effectively bolster the investor’s financial standing, aligned with their long-term retirement goals and risk appetite. This decision will be based on an exhaustive analysis of historical financial data, current market trends, risk evaluations, and projections of future economic conditions.
Analysis of Financial Information
To reach a conclusive decision on the investment opportunity in Tesla, it was essential to thoroughly scrutinize the company’s financial performance. Exhibit A showcases Tesla’s key financial metrics and ratios, juxtaposed with those of General Motors (GM), to assess the company’s financial health.
Reviewing the historical financial data for Tesla and GM reveals critical insights to inform an investment decision. Tesla has shown remarkable growth in total revenue, surging from $53,823,000 in 2021 to $96,773,000 in 2023, a sign of strong market demand and effective operational scaling. Its net profit margin has risen from 0.10 in 2021 to 0.15 in 2023, indicating improved profitability and efficient management. Furthermore, Tesla’s current ratio has climbed from 1.38 in 2021 to 1.73 in 2023, reflecting improved short-term financial stability, and its liabilities-to-assets ratio has also improved, indicating a stronger balance sheet. However, Tesla’s high Price-to-Earnings (P/E) ratio, although reduced from 116.92 in 2021 to 43.30 in 2023, suggests market optimism about its future growth but also highlights its potentially overvalued stock.
On the other hand, General Motors (GM) has demonstrated consistent revenue growth, increasing from $127,004,000 in 2021 to $171,842,000 in 2023, indicating steady market performance. Despite this, GM’s net profit margin has declined, signaling profitability challenges. The company has maintained a consistent current ratio of around 1.10, which supports financial stability, yet its liabilities-to-assets ratio of 0.75 in 2023 indicates substantial reliance on debt. GM’s 2023 P/E ratio of 3.88 could suggest the stock is undervalued or that there is less optimism about its future growth.
This analysis reveals that the choice between investing in Tesla or GM hinges on the investor’s preference for Tesla’s potential for rapid growth and higher volatility, or GM’s stability and possibly undervalued stock. Therefore, understanding the investor’s risk profile is imperative to finalize the investment decision.
Investor’s Risk Profile
The investor under consideration has a liquid net worth of $1,000,000, with a portfolio allocation comprising 40% in the S&P 500 index, 40% in a medium-duration, high-quality bond fund, and 20% in a savings account earning 5% per year. This diversification provides significant insights into the investor’s risk tolerance and the potential capacity to take on more risk in pursuit of higher returns.
Investing 40% of the portfolio in the S&P 500 index indicates a balanced approach towards capital growth, as the S&P 500 is typically composed of large-cap US equities representing a broad spectrum of industries (McFarlane, 2023). Historically, the S&P 500 has delivered average annual returns of around 7-10% but comes with volatility that reflects the overall market’s performance (McFarlane, 2023). The choice to allocate a substantial portion to this index fund suggests comfort with the inherent market risk associated with equity investments, albeit within the generally more stable framework of large-cap stocks.
The allocation of another 40% in a high-quality bond fund introduces a stabilizing factor into the portfolio. Bonds, particularly those of medium duration and high quality, are typically less volatile than stocks and provide regular income, thus serving as a buffer against market downturns (French, 2023). This portion of the investment is crucial as it underlines a strategy geared towards capital preservation and income generation, which are characteristics of a conservative to moderate risk profile.
The final 20% of the portfolio in a high-interest savings account is the most conservative investment, offering stability and liquidity with a guaranteed but lower return. This allocation indicates a strategy that prioritizes capital protection, which is particularly important for managing short-term financial needs without compromising the portfolio’s overall integrity.
Given this diversified portfolio structure, the investor is currently positioned within a low-to-moderate-risk-tolerance framework. However, this configuration also provides the investor with the flexibility to take on additional risk. Since a significant portion of the portfolio is already allocated to relatively stable investments, the investor could consider higher-risk opportunities, such as individual stocks like Tesla, to potentially enhance overall portfolio returns. This strategy leverages the stability provided by bonds and savings to offset the higher volatility and possible higher returns from such an equity investment.
Considering the Market’s and Economy’s Future Trends
To make a sound investment decision, it is crucial to consider market and overall economic conditions in the US. Therefore, electric vehicle (EV) market trends and inflation rates were assessed to determine their effects on the investment choice. The data on vehicle sales, particularly focusing on the growth in sales of Battery Electric Vehicles (BEVs) and Plug-in Hybrid Electric Vehicles (PHEVs), showcases a significant upward trajectory in the adoption of EVs, as demonstrated in Exhibit C. From 2016 to 2028, there is a clear and consistent rise in total vehicle sales, with a pronounced increase in the sales of BEVs (Statista, 2024). This trend indicates shifting consumer preferences towards more sustainable automotive solutions and growing acceptance of EV technology.
Tesla, being a pioneering and leading manufacturer in this segment, stands to benefit greatly from these market trends (Tesla Inc., 2024). The growth in BEV and PHEV sales not only supports Tesla’s core business model but also highlights its potential to capture a larger market share as the demand for electric vehicles continues to rise. This positions Tesla as a strong contender for growth-focused investment, particularly given its innovative capabilities and expanding production capacity.
The inflation rate data in Exhibit C provide insights into broader economic conditions that could affect consumer spending and cost structures in the automotive industry. Notably, the spike in inflation to 8% in 2023, followed by a projected stabilization and gradual decrease to more normal levels by 2028, suggests a period of economic volatility but eventual normalization (Statista, 2023). High inflation typically erodes consumer purchasing power, which could temporarily slow down high-ticket purchases like vehicles. However, Tesla’s luxury brand positioning and its market segment’s relative insulation from immediate economic downturns may buffer it against severe impacts (Tesla Inc., 2024). Moreover, as inflation stabilizes, consumer confidence and spending power are likely to recover, potentially further boosting vehicle sales.
Assuming future trends are accurately estimated, investing in Tesla could be seen as an opportunity to capitalize on anticipated growth in the EV market, despite the potential risks posed by economic fluctuations reflected in inflation rates. The robust growth in BEV sales underscores a strong market shift towards electric vehicles, where Tesla has a significant competitive edge. Furthermore, Tesla’s ability to innovate and scale production aligns with these market trends, making it a potentially lucrative investment with a higher risk-reward profile than the stable yet lower returns of a bank account.
Analyzing Expected Annual Returns
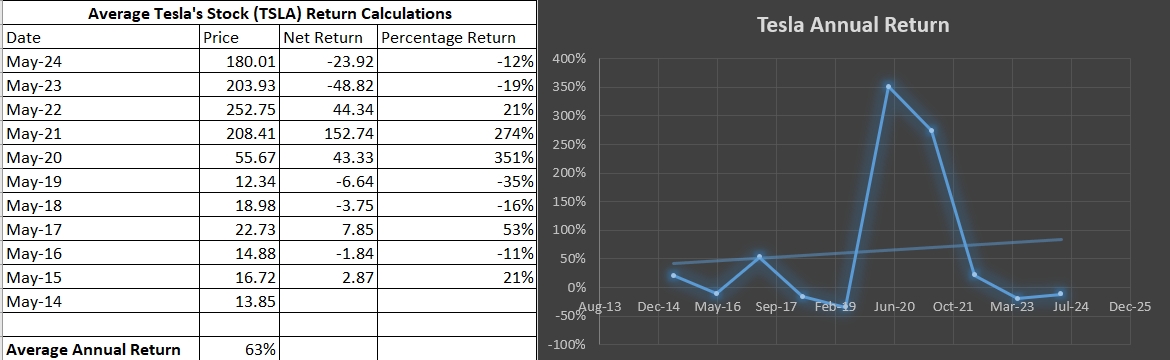
It was assumed that the critical factor for deciding on the investment opportunity was. While the expected annual return for the savings account was clear (5%), it was necessary to calculate the annual return for Tesla’s common stock. Two approaches were considered to determine the returns, as shown in Exhibit D. First, average annual returns were calculated over the past 10 years. The results demonstrated that the average annual return on the stock was 63%, which was considered very optimistic.
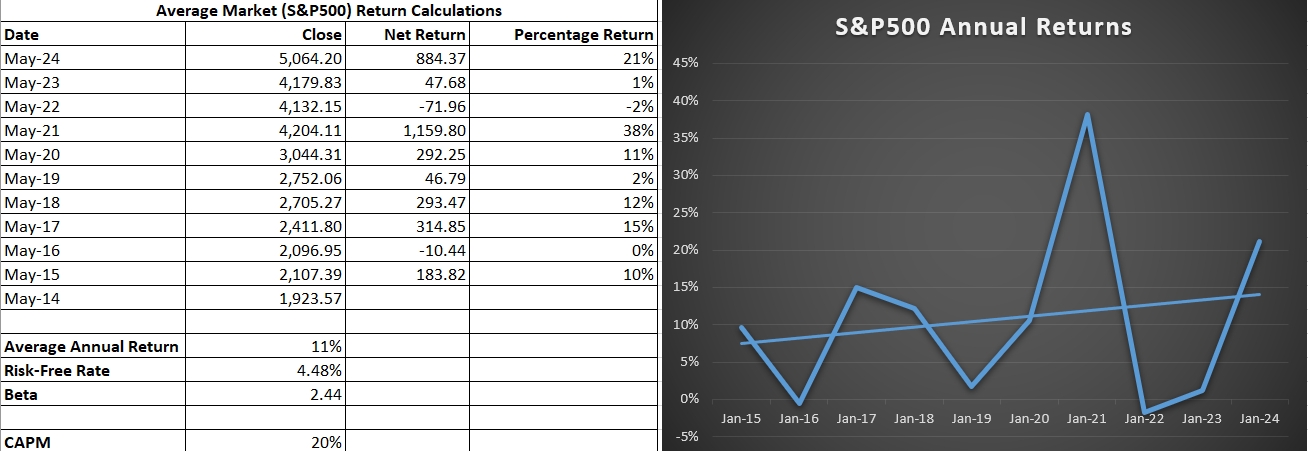
Given the high volatility of the investment, the Capital Asset Pricing Model (CAPM) was used to determine required returns. These returns using the CAMP model can be calculated with the following formula:

The risk-free rate is generally derived from government securities and represents the baseline return an investor expects without taking on any risk. In this scenario, the risk-free rate is given as 4.48%. Beta is a measure of the investment’s volatility relative to the overall market. A beta of 2.44, as noted here, indicates that the investment is significantly more volatile than the market. This means it is expected to move more than twice as much as the market under the same conditions, either up or down. The expected market return is the average rate of return anticipated from the market, based on historical data. In this case, the average annual return of the S&P 500 is used as a proxy for the expected market return, which is stated to be 11%. This figure shows the compounded annual growth rate of the S&P 500 over the period considered.

Since the expected returns of 63% were higher than the required returns and those from the savings account, it was recommended to invest in Tesla’s common stock.
Conclusion
In conclusion, this investment analysis has comprehensively evaluated the potential of investing $100,000 into Tesla’s common stock versus retaining it in a high-yield savings account. Considering Tesla’s substantial revenue growth, improved profit margins, and a strong balance sheet, the company is well-positioned for future expansion and capable of delivering significant returns. Despite a high Price-to-Earnings ratio suggesting potential overvaluation, Tesla’s leadership in the expanding electric vehicle market presents valuable growth opportunities.
The investor’s diversified portfolio, which includes equities, bonds, and savings, provides a stable foundation that can effectively mitigate the higher risks associated with Tesla’s stock. This stability, coupled with the strategic portfolio allocation, indicates a capacity to tolerate greater volatility in pursuit of higher returns.
Market analyses and economic conditions further support an investment in Tesla, particularly given projected growth in electric-vehicle demand and long-term economic stabilization. Calculations using historical data and the CAPM confirm that Tesla’s expected returns are compelling relative to the conservative savings account option. Therefore, the recommendation is to invest in Tesla’s stock, aligning with the investor’s financial goals and appetite for growth-focused opportunities, thereby enhancing portfolio profitability through a well-informed, risk-managed approach.
References
French, B. (2023). What is the Role of Bonds in Your Portfolio?
McFarlane, G. (2023). The S&P 500: The Index You Need to Know.
Statista. (2023). Projected annual inflation rate in the United States from 2010 to 2028.
Statista. (2024). Electric Vehicles – Worldwide.
Tesla Inc. (2024). Annual report 2023.
Yahoo Finance. (2024a). Tesla Inc. (TSLA).
Yahoo Finance. (2024b). General Motors Company (GM).
Exhibits
Exhibit A: Key Financial Metrics TSLA vs GM
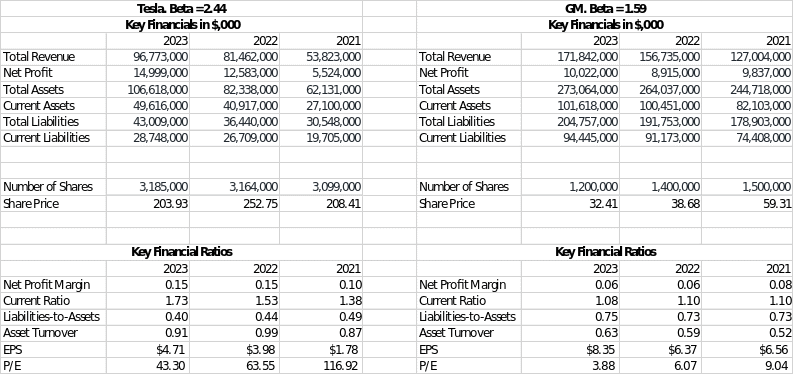
Exhibit B: EV Market Projections
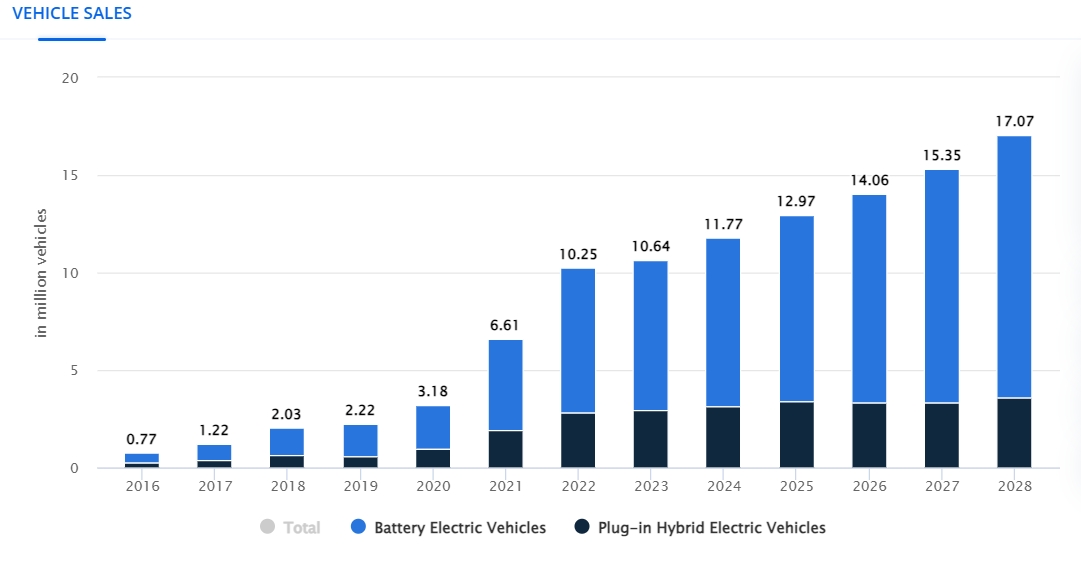
Exhibit C: Projected Inflation Rates
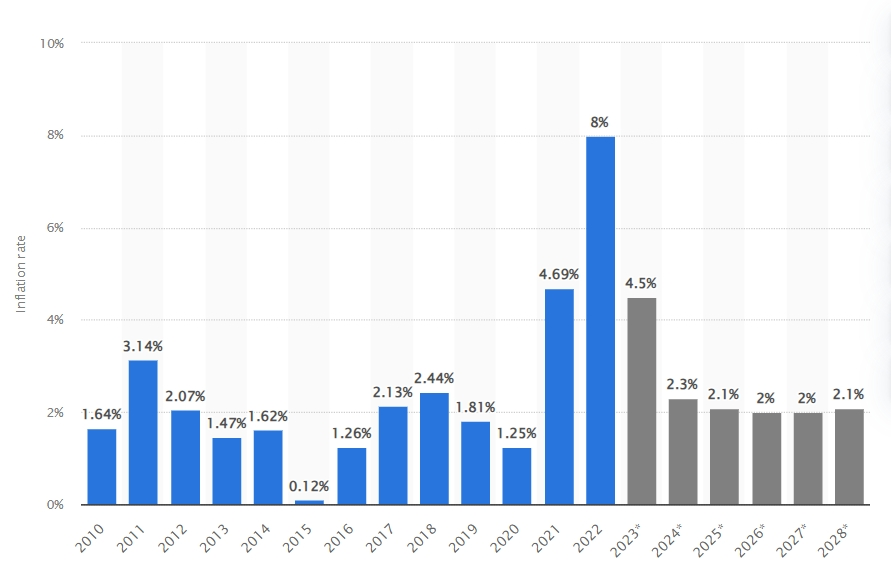
Exhibit D: Tesla’s Projected Annual Returns