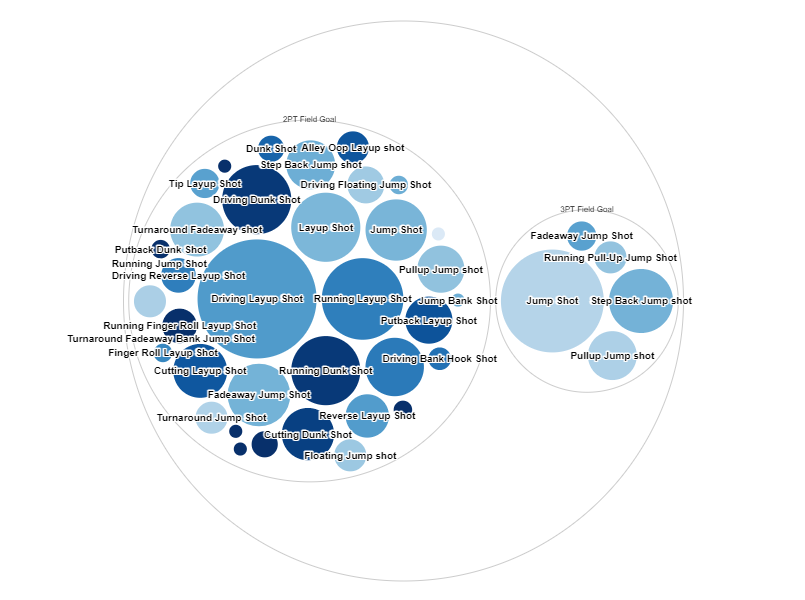
This circle packing chart shows values of variables in a hierarchical structure by using circle areas. The shot type variable creates two outer circles which display two types of shots in the database: 2PT Field Goal and 3PT Field Goal. Inside each of them, many other circles represent unique action types which differ in size and color. In this chart, the size represents the sum of made shots, whereas intensity of color stands for the average amount of made shots in each category (shot and action types). For instance, it is visible that the action type “Jump Shot,” which is the most popular in the shot type “3PT Field Goal”, is among the average in terms of made shots in the “2PT Field Goal.” Moreover, the highest values of the average amount of shots made in each category are in “2PT Field Goal”, with “Diving Dunk Shot,” “Running Dunk Shot,” and others. These circles have the darkest colors of all, so mentioned action types have the highest number of shots made on average.