Introduction
The regression model describes the relationship between dependent and independent variables by fitting a line to the observed data. In the study conducted by the cleaning company, linear regression will be used to estimate how rating changes when time experiences change. The variables in the cleaning company are quantitative, and that’s why they qualify for a regression analysis to identify if there is a linear relationship between them (Reid et al., 2019). Since there was one independent variable, linear regression was performed using Excel, and the output was as shown below.
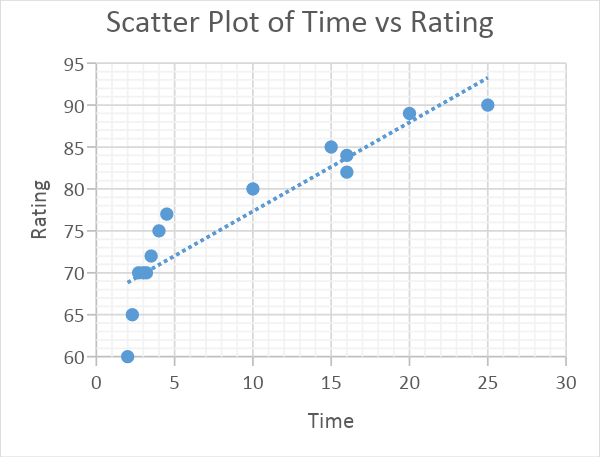
Figure 1 shows the graphical scatterplots of time and rating variables where time is an independent variable and rating is dependent. Additionally, the trend line on the figure shows the direction of the relationship between time and rating. The trend line slope indicates that there is a positive linear relationship between variables (Reid et al., 2019). This is a clear indication that as time increases, the rating increase. Therefore, it can be concluded that when the cleaning company spends more time on their services are likely to get a better rating from a customer.
Hypothesis Tests
- Null hypothesis: If the relationship between time and rating is not significant, the slope will be equal to zero.
- Alternative hypothesis: If the relationship between time and rating is significant, the slope will not be equal to zero.
Analysis
The significant level for this study is 0.01, and a linear regression t-test is conducted using the data collected by the cleaning company to determine if the slope of the regression line differs significantly or not. After performing the regression t-test in Excel, the following output was obtained.
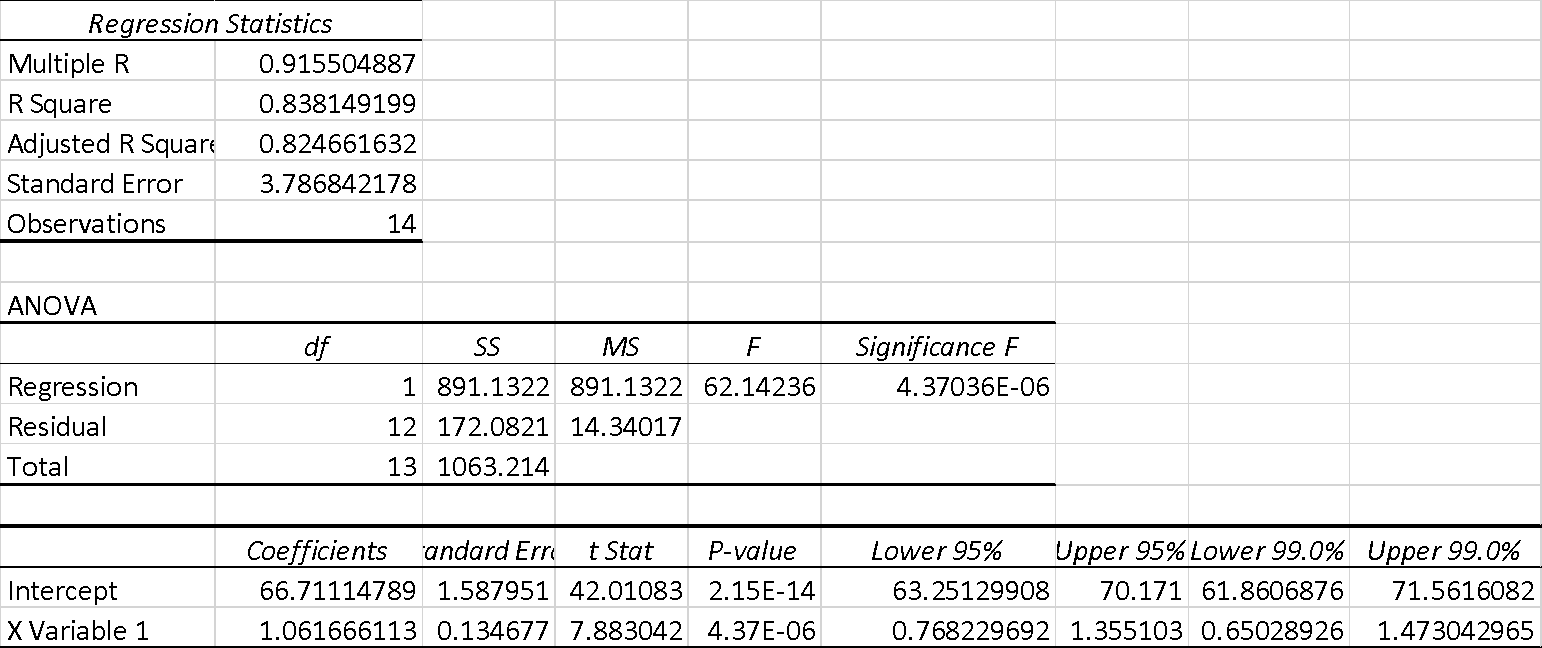
Since the multiple R in figure 2 is 0.92, it indicates a strong positive relationship between time and rating. Further on, R2 is 0.83, which suggests that 83% of the data values fit the regression model analysis. This indicates that the R squared is not good because it is less than 99%. Additionally, the data has 0.84 independent variables in the model (Reid et al., 2019). In general, the collected seems to be a goodness-of-fit measure as it has a small standard error value.
The ANOVA table in figure 2 shows that p<0.01, we reject the null hypothesis and accept the alternative hypothesis. Due to this, it can be concluded that the relationship between time and rating is not significant, and the slope will be equal to zero (Reid et al., 2019). Additionally, the regression analysis output is helpful because it is used to create a linear regression equation y=bx + a. In this study, y is the rating, while x is time.
Y= xvariable1 coefficient*x + intercept
Reading the coefficient and intercept from figure 2, the linear regression equation will be:
Y=1.0617x+ 66.711
Using the linear regression equation, how a change in the independent variable affects the dependent variable can be calculated.
Conclusion
In general, the data collected by the cleaning company qualified for regression analysis because it is quantitative. After performing linear regression using a scatterplot, the data had a positive relationship between time and rating. Additionally, the linear t-test revealed a strong positive relationship between the two variables regardless of some points being on the outlier. Generally, when more time is spent on the cleaning services, the better rating it receives from the customers.
References
Reid, J., Proctor, R., Sigman, M., & Phipps, R. (2019). Predictive multivariate linear regression analysis guides successful catalytic enantioselective minisci reactions of diazines. Journal of the American Chemical Society, 141(48), 19178-19185.