Theories
Based on the iSixSigma framework, the phenomenon of changes in the quality of products released by Sikorsky Aircraft can be explained by considering the array of factors affecting the quality assessment (QA) process through the prism of the following equation:
 , where “Y” is the phenomenon analyzed and “x(s)” include the factor or factors affecting the quality rates (Kubiak & Benbow, 2009a). Given the current situation at Sikorsky, using the formula above, one can represent the relationship between the quality rates and the rest of the factors in the following manner:
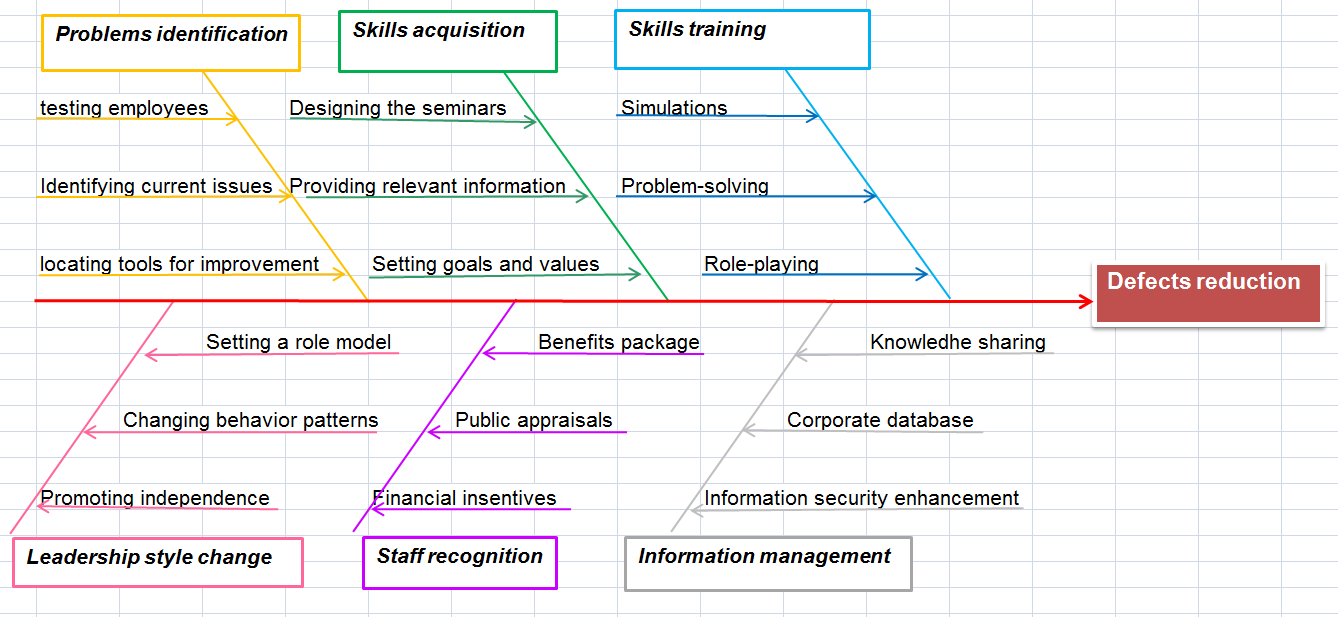
 , where PQ is performance quality, ML is motivation levels, and P is a proficiency of the employees. The Total Quality Management (TQM) and the Just-in-Time (JIT) framework will have to be used for the analysis (Kubiak & Benbow, 2009b).
CE Diagram
Data Collection Plan
The process of data collection involves carrying out an assessment of the staff’s performance before and after the training, with the following analysis of the data, as well as the identification of the changes in the staff’s performance quality. Particularly, the percentage of defects omitted by the members of the QA Department after the training is facilitated and the corresponding values are incorporated into the company’s ethics, mission, and vision, will have to be identified. Afterward, the retrieved percentages will be compared to the data acquired from previous assessments so that the correlation between the operations of different teams could be located on the specified time slots.
Hypothesis Tests
Description
In order to check whether there has been any significant improvement in the performance of the staff members after the training has been provided and the corresponding adjustments have been made to the company’s mission and vision, the ANOVA tool will be applied to identify the possible changes in the performance rates of the people employed at Sikorsky Aircraft. The percentage of defects occurring in the course of the QA processes will be compared. Particularly, the ANOVA test will help show whether the delivery of each team is consistently similar, as well as show whether there have been any improvements in the performance rates (Kubiak & Benbow, 2009c).
Application
There has been a significant improvement in the overall quality of the employees’ performance. Similarly, the ANOVA tests have shown that, compared to the previous performance rates, the current ones are much more homogenous (see Table 1). Differently out, the employees have been delivering a similarly positive performance since the training session.
Table 1. ANOVA Test Outcomes.
Indeed, a closer look at the outcomes of the testing process reveals that the current p-value (approximately 0.04) allows dismissing the null hypothesis. In other words, the results of the test indicate that there is an evident correlation between the provision of the training and the staff’s performance rates (Kubiak & Benbow, 2009d). The application of the test, therefore, has shown quite graphically that there is a strong need in introducing the staff members to the concept of the rapidly changing realm of quality assurance.
More importantly, the employees will have to be provided with an opportunity to explore the identified areas independently. For this purpose, they must be offered a set of skills related to independent learning. The results are expected to be quite impressive; some of the staff members may deliver a stellar performance, whereas the rest are likely to perform at least above average. Consequently, a significant reduction in the percentage of errors made during the QA process is likely to drop.
Reference List
Kubiak, T. M., & Benbow, D. W. (2009a). Chapter 24: Measuring and modeling relationships between variables. In The Certified Six Sigma Black Belt handbook (2nd ed.) (pp. 183-229). Milwaukee, WI: ASQ.
Kubiak, T. M., & Benbow, D. W. (2009b). Chapter 25: Hypothesis testing. In The Certified Six Sigma Black Belt handbook (2nd ed.) (pp. 230-277). Milwaukee, WI: ASQ.
Kubiak, T. M., & Benbow, D. W. (2009c). Chapter 26: Failure Mode and Effects Analysis (FMEA). In The Certified Six Sigma Black Belt handbook (2nd ed.) (pp. 278-282). Milwaukee, WI: ASQ.
Kubiak, T. M., & Benbow, D. W. (2009d). Chapter 27: Additional analysis tools. In The Certified Six Sigma Black Belt handbook (2nd ed.) (pp. 283-292). Milwaukee, WI: ASQ.