What, if anything, does the Employment/Population (E/P) profile for the United States from 2007 to 2012 tell you about short-run economic growth over that period?
The rise in the unemployment rate in the United States after the economic recession of 2007-2009 was severe and unprecedented. During this period, the unemployment rate rose from a low of 4.4% in 2007 to 10% in late 2009, which is higher than an average increase of 5.6% experienced in the 1979-1982 recession periods. Despite many policy responses (fiscal and monetary) that have seen the unemployment rate declined to a low of 7.6% in March 2013, employment conditions still remain unstable hampering sustained economic recovery.
Most of the economic policies adopted have improved employment conditions. However, the decline in the unemployment rate can also be attributed to discouraged workers drop out of the workforce and thus stripped of their unemployed status. Individuals are considered unemployed if they are available for work, are jobless, and actively seeking employment. The employment to population ratio (E/P) refers to the proportion of the U.S. population who are working; it is not affected by the participation rate of workers in the labor market. Some important definitions include:
Participation rate = work force/civilian population
The employment to population ratio (E/P) = Employed population/civilian population
Unemployment rate = Unemployed population/labor force
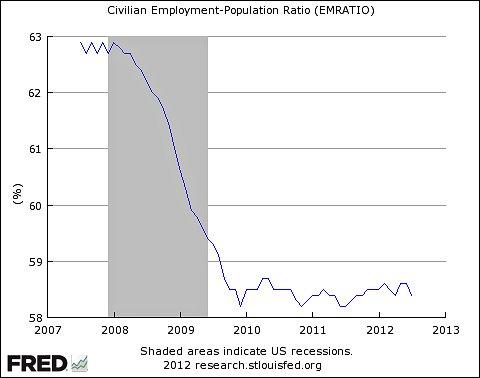
The E/P has remained low from the recession period through the three-year period of slow economic recovery. The graph above shows that the employment to population ratio for the 25 to 54 age group has declined. This is correlated to an increase in the unemployment rate, an overall reduction in demand for labor, and the decline in the participation rate. Labor market participation is an indicator of the level of interest in working in the workforce; thus, the low participation rate indicates a decline in interest in working due to poor job prospects and low wages. It may also suggest that people have decided to seek more skills by pursuing higher education in the hope that they will receive better wages later when they get employed.
The E/P ratio is also a strong indicator of market conditions. The low 2009-2012 E/P ratio indicates that the U.S. economic growth is low in that people are not able to find jobs resulting in an increase in the unemployment rate over the same period. The U.S. economy has been in recovery since mid-2009; but, the pace of recovery has been uneven and slow. The slow growth cannot lead to the sustained growth of the labor market, hence the rise in the unemployment rate.
The figure below is an index of the multilateral real exchange rate (ε= EP/P*) for the British pound (GBP). (i) Explain why the multilateral real exchange rate may be used as a measure of international price competitiveness. (ii) Following an increase in the real exchange rate expenditure on imports is typically expected to decline. True, False, or Uncertain? Explain.
(i) The multilateral real exchange rates are calculated based on a number of currencies. The multilateral exchange rates help to determine the dynamics and performance of a country’s currency relative to major world currencies. In calculating multilateral exchange rates, one takes a number of world currencies, assigns them relative weights, and then computes the country’s currency exchange rate.
International competitiveness is the relative price of domestic goods in terms of a particular foreign currency. In this regard, a country’s competitiveness increases with a decline in the relative price of its goods. Therefore, the nominal exchange rate is not a good indicator of international competitiveness as changes in relative prices also affect trade across countries. The multilateral real exchange rate (ε= EP/P*) is a good indicator of competitiveness as it corrects the nominal exchange rate (E, which is the foreign currency/domestic currency per unit ratio) by foreign price (P*) and domestic price (P). The E and P* are averages based on long-run domestic trade patterns.
The underlying model uses the relative prices of goods between countries and is based on the assumption that the market is imperfect i.e., both domestic and foreign goods are not perfect substitutes of one another and hence the adjustment of ε. If the adjustment was immediate and the tradable goods substitutable i.e., the same as between countries, then there would be no variation in competitiveness as purchasing power parity (PPP) would be a constant. But, this is usually not the case. The real exchange rate, therefore, applies to international trade, where there is a departure from the law of one price and thus a useful measure of international competitiveness.
(ii) False. An increase in the real exchange rate is an indication that the foreign price (P*) of particular tradable goods has increased when compared to the domestic price (P). This means that the real value of the U.S. currency (dollar) has declined i.e. the purchasing power of the dollar, relative to a foreign currency (country B, e.g. the Japanese Yen), has gone down. More dollars will be needed to buy a yen as the loss of purchasing power of the dollar means that the yen gains more value relative to the dollar. This means that importers in the U.S. will spend more to import tradable goods from country B when the real exchange rate has appreciated. Thus, following an increase in the real exchange rate, a country’s expenditure on imports will rise.
With the aid of a diagram explain the equation set out below: W/P = f(u, z). Where W/P is the real wage, u is the unemployment rate and z is a vector of external variables. (i) Using your diagram from (i) above illustrates the impact of a rise in unemployment benefits. Explain your answer.
The equation W/P = f (u, z) is a wage-setting (WS) equation. An equilibrium in the labor market is attained when the WS relation is equal to the price-setting (PS) equation. The WS is the employees’ bargaining place while the PS is the company’s position. The wages (W) are affected by price (P), unemployment rate (u) and external variables (z). There is a positive correlation between P (price level) and W (workers’ wages) and a negative correlation between the unemployment rate (u) and wages that workers demand.
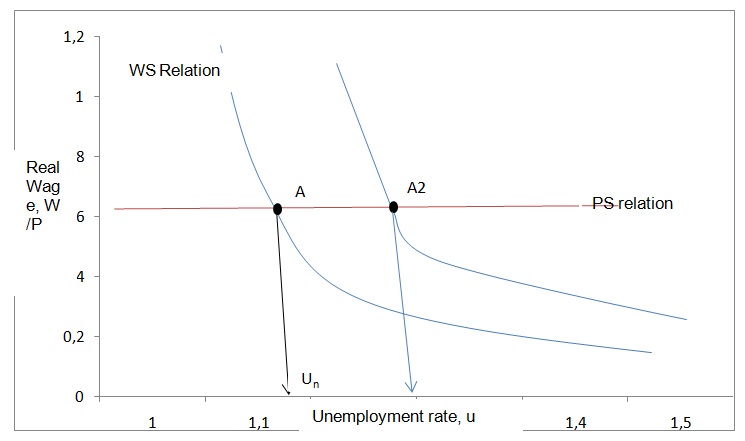
The unemployment rate is the rate where the real wage selected in WS is equal to the real wage in PS relation. The WS relation reduces when the unemployment rate increases while the PS relation is not affected by the unemployment rate. An increase in the price level implies that workers will demand higher wages. There is a negative correlation between the wage demanded and the unemployment rate. In the labor market, an equilibrium is reached when WS = PS i.e. the price level charged for goods sold is in equilibrium with labor costs, W, taking into account some constant, x. The constant x is determined by the influence of companies in the labor market. The intersection between WS and PS relation is the actual unemployment rate, Un.
(ii) From the graph, it is clear that a rise in unemployment benefits results in a corresponding increase in the unemployment rate. The amount of unemployment benefits is included among the variables, z, in the WS relation W = P.F (u, z). A rise in the unemployment benefits will lead to a corresponding increase in z. This will cause a shift in the function on the W/P graph. The reason for this is that with a rise in unemployment benefits in all job cadres, employers have to increase the wages to attract workers into the job market. In this case, the labor force has a higher bargaining power than firms. This will cause the WS relation to shifting to the right resulting in an increase in the unemployment rate. Thus, higher benefits would result in a high unemployment rate in a country.
Explain the concept of the ‘sacrifice ratio’ and its relationship to disinflation
The sacrifice ratio refers to the cost of outputs that result from a reduction of the inflation rate by one percentage point over a given period. One way of reducing inflation is through stringent monetary policies that lower the inflation rate by one percent over a given period. The sacrifice ratio is determined by the total gaps in outputs (differences between potential and actual outputs), which is given as a percentage of Gross Domestic Product (GDP). The total output cost is equivalent to the GDP lost over a particular period.
The sacrifice ratio is usually used to determine the effects of real monetary policies. It is an important concept in the empirical and theoretical analysis of economic situations in a country, by expressing it in a single unit of cost measure. The computation of the sacrifice ratio entails two steps; identification of changes in monetary policy (to determine the differences between disinflation and inflation episodes) and assessing their effects on inflation and output gaps. There are many methods for estimating the sacrifice ratio.
One of the ways of computing the sacrifice ratio is the “Philips curve” method that takes into account episodes of inflation and output costs within a given period. According to this method, the United States has a sacrifice ratio of 10%, which means that a decrease in inflation by one percentage point will result in a 10% decline in Gross Domestic Product (GNP). However, this approach has some limitations: the inflation-output relation is assumed to be a constant during the entire period of the analysis i.e. it remains constant during periods of accelerating inflation and disinflation. The Philips curve method also assumes that the output cost of tackling inflation remains the same in all disinflation episodes during the entire period being examined. The computation of the sacrifice ratio involves identifying specific disinflation episodes, which are located on the peaks and dips of the inflation graph. The sacrifice ratio for the disinflation episodes is computed from the total output costs in a given duration.
The sacrifice ratios often vary from one country to another. This can be attributed to a variation in economic conditions. Fluctuations in oil prices may cause rapid disinflation, which will affect the inflation rates and subsequently the sacrifice ratio. The reduction in the sacrifice ratio may be related to citizen’s inflation expectations and the decline in central bank credibility. These two factors determine the output costs required to reduce high inflation. For instance, in the 1980s, the central banks of most European countries faced low credibility resulting in disinflation. This slowed the efforts of fighting high inflation. Also, these actions increased the inflation rate forcing governments to adopt disinflation policies resulting in high output costs. Thus, the credibility of central banks and a country’s expectation of inflation, especially when fighting inflation can affect the cost of disinflation. A country’s sacrifice ratio decreases when the disinflation costs are low and increases when the disinflation costs rise.