In the not-so-distant past video games catered to a very small market of dedicated young enthusiasts. However, from games like Mario and Pac-Man to the advanced next-generation consoles and video games that exist today, the video game industry has evolved into a global powerhouse. Subsequently, all the members of the gaming industry’s value chain have benefited from this evolution.
Publishers
One of those members is the Publishers, which have grown into huge and successful businesses themselves. Their chief responsibility is to fund the actual developers of the video games, manage the sales and marketing aspect of the finalized product and take proactive business decisions which make a videogame better suited to certain markets. Some of the biggest Publishing houses include Electronic Arts, Activision, and Take-Two Interactive Software. However, the rapid improvement in technology and increases in innovative solutions for both hardware and software means that consoles have a very short lifespan. For publishers, this translates as regular large-scale investments in new next-generation console launches, which require larger development teams and longer developmental cycles.
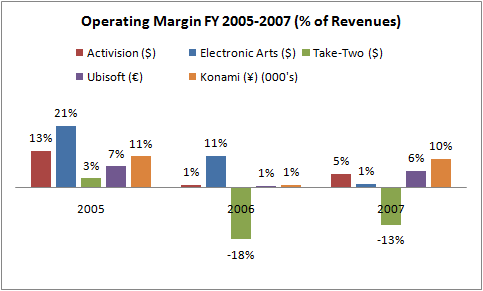
Operating Margin FY 2005-2007
These regular Investments increase the cost of doing business for publishers and significantly reduce their respective operating margins (the amount of money a company earns on each dollar of sales before interest and taxes). The graph presented above depicts the changes in the operating margins of the major publishers of the industry from the fiscal year 2005 to 2007. We can observe from the diagram that subsequent launches of the next-generation consoles such as the Xbox360, PS3, and Wii in 2006, 2007, and 2007 respectively have significantly reduced the operating margins of the major publishing companies. The lowest Operating Margins were calculated in FY2006. The graph further shows that Electronic Arts in comparison to other publishing companies performed strongly and posted operating margins of 21% and 11% in 2005 and 2006 respectively. Activision and Konami earned operating margins of 13% and 11% respectively, however, in FY2007 Konami Posted the largest Operating Margin of 10% as compared to the other major Publishing Companies mentioned in the Diagram. However, the worst-hit company was Take-Two Interactive which posted negative operating margins of 18% and 13% in FY2006 and FY2007 respectively. This dismal performance can be attributed to the delays in the availability and consumer acceptance of certain next-generation consoles, delays in adjusting to the new support and game development perihelia for the new hardware by the game developers, and lower average selling prices of the Company’s video games for current-generation systems (i.e. PS2 and Xbox). Additionally, fiscal 2006 and 2007 performance reflected higher development costs for Take-Two’s next-generation titles and the Company’s continued investment in building its sports division, 2K Sports.
Reducing Time and Cost Expenditure
One way to improve Operating Margins is to constantly innovate and come with novel ideas to minimize costs and time delays in developing new video games for next-generation consoles, such as providing technical assistance to developers so that they can become adjusted to the new format, support software and developing kit provided by the manufacturer of the hardware in a lesser amount of time. A company could also acquire a development house to further reduce costs and integrate resources and ensure that it has exclusive access to quality developers. Another way could be to secure publishing contracts of those games that promise a lot of potentials, provide an already existing and profitable market (this happens usually in the case of sequels such as FTA Vice City), and need a lesser amount of funding to be developed.
Shortcomings
Although the diagram is very accurate in depicting the current situation regarding Operating Margins, it fails to explain the overall effect of the reduction in the operating margins on the future strategic outlook of a company. It also fails to point out that the smaller margins are expected at the time of console launches because after a burst of sales at their initiation hardware sales tend to slow down, and the console manufacturers software companies (both Development and Publishing Houses) settle into long-term revenues from game sales and thus cash in from their initial expenditure. If we take the example of taking Two Interactive its negative margins might look like a cause for concern if we analyze them while only keeping their present perspective in mind, however while costly in the short term, these strategic initiatives were expected to have a positive impact on the Company’s future performance as consumers increasingly transition to next-generation platforms. As of on cue the first major game for the next generation consoles released by taking Two Interactive, Grand Theft Auto IV, generated over 3.6 million units, equivalent to $310 million. And by the end of the first week, it sold over 6 million units globally, generating income of approximately $500 million.
Conclusion
The Video Game Industry is constantly evolving and for the industry to sustain its successful evolution innovative, risky, and strategic initiatives have to be taken that prove beneficial for the company and the industry as a whole in the future. Expenditures at the time of new hardware launches might look daunting and might decrease operating margins in the short term but these measures are absolutely necessary to give a publishing company a strong foothold in the future. The Video game Industry earned $40Billion in 2007 with US software sales amounting to $15.8Billion. These facts serve as a testament to the success of the strategic initiatives taken by various Publishing Companies in the past.
References
Graph Diagram “Operating Margins FY2005-2007 (% of revenues)”. Web.