Introduction
The control process is applicable in various disciplines like manufacturing, healthcare, financial consulting, processing among others. In hospitals, control theory is useful in managing cases and monitoring the healing process of patients. One such application of control theory is performance appraisal in the hospital to achieve dependable, reliable, and consistent healthcare service. Hospitals provide curative and preventive services to patients. In order for hospitals to monitor effectively the patients’ progress, tools of quality are important in assessing the capability and confidence of systems. The service output is subject to variations in different parameter measurement.
Control charts in hospitals
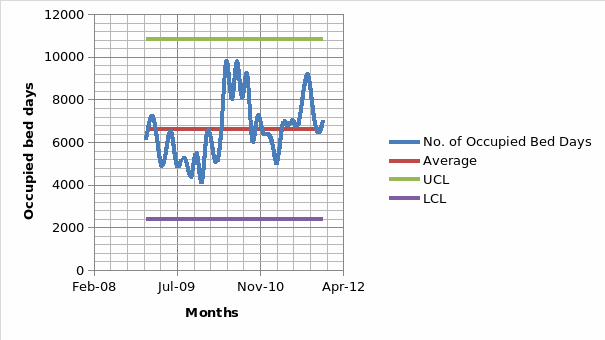
One aspect of control in a hospital is in evaluating the number of bed occupancy days. Control charts help in displaying the performance of a process over time. It is identified by downward and upward trends, occurrence of cycles and other variables for further investigation. The chart was chosen so that it could show an average line to be a representation of bed occupancy of all the days that are recorded. It can be added to the chart so that the movements of the readings can be elaborated further. The bed occupancy average is shown on the x-axis. A Variety of attributes can enable tracking on of similar charts in which each variable will have its own line. This case expresses the application of single variable for clarity and simplistic understanding. Crucial is the capacity of control charts to track improvements in the hospital by monitoring what has been installed to help in the determination of patient success rates. These attributes are shown in the below graph.

The process shown above is slightly unstable despite the points appearing to spread randomly about the centre line. However, the points rise sharply showing a situation where more patients will have been kept on their beds for some time. The hospital administration in this instance tries to investigate the increase in days of admission of patients to the facility. No trend shows on the upper center line as the deviations quickly soared below the centre line. Moreover, the huge variations in the bed occupancy statistics collected prove difficult to validate this type of trend thus, continuously monitoring of the process for any sign of a trend that might help indicate some relevance.
Feedback loop in hospitals
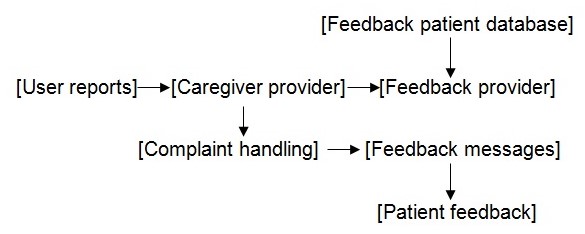
The second scenario is a hospital complaint feedback loop which is intended to provide patients with information necessary to mitigate effects of delayed services. The loop will like the one below.

The patients will feel their queries and complaints have been answered if there is positive feedback to a recurrent circumstance. It is the obligation of feedback consumer to locate the source and type of the initial message which is received in the reports for any action to be taken. A feedback provider in this instance cannot make judgments on the complaint’s validity, which exceeds what the technical data, that has been considered by the feedback provider. Each complaint received in the hospital is forwarded to the feedback consumer department with a human element thus enabling additional applications to be actionable based on the receipt of individual reports. Feedback providers will communicate and evaluate the kinds of complaints and their validity. They will only communicate when actions were taken and further with the end user who had initiated the complaint.
References
Carey, R.G (2008). Improving Healthcare With Control Charts: Basic and Advanced Spc Methods and Case Studies, ASQ Quality Press.
Doty, L.A. (2006). Statistical Process Control, Industrial Press Inc.
Engelbrecht, R. (2009) Connecting Medical Informatics and Bio-informatics: Proceedings of MIE2005 : The XIXth International Congress of the European Federation for Medical Informatics, IOS Press.