Introduction
Joblessness and inflation rates are essential economic indicators that have a substantial impact on a country’s economic well-being. Parts one and two of this report explore the complex link between redundancy and inflation. Part 3, on the other hand, reveals a complete study of non-employed statistics broken down by labor force categories and duration. These parts, taken together, give useful insights into the complex patterns of economic events that drive policy decisions.
The Unemployment Rate
Month and Year Summary
The information in this report is for the month of August 2023. The overall number of nonfarm payroll jobs climbed by 187,000, but the unemployment rate jumped to 3.8 percent (Employment Situation Summary, 2023). This represents a 0.3 percentage point increase above the preceding month’s rate of 3.5 percent in July.
Demographics
Adult men were unemployed at a rate of 3.7%, while adult women were unemployed at a somewhat lower rate of 3.2%. Teenagers had a much higher percentage of 12.2%. Blacks had a 5.3% out of work rate, Hispanics had a 4.9% rate, Whites had a 3.4% rate, and Asians had a 3.1% rate. When related to the prior month, adult male, White, and Asian unemployment rates climbed marginally, indicating a slightly more severe work market for these categories.
Factors
- Changes in labor-force participation. People leaving or reentering the labor force have an effect on the number of jobless (Wiertz & Lim, 2019).
- Seasonal influences such as weather and holidays.
Economic Implications
Unemployment is a significant economic concern with far-reaching implications. It leads to decreased productivity since unemployed people are unable to actively contribute to the economy, resulting in a decrease in overall economic production (Wiertz & Lim, 2019). Furthermore, it exacerbates economic disparity as individuals without work struggle to satisfy their financial obligations.
Non-Economic Effects
The unemployment rate has a societal impact or influence in a variety of ways. For example, it can have a negative impact on mental health, creating stress, despair, and other concerns in individuals who are unemployed (Maisch, 2022). Furthermore, high rates of joblessness have the potential to exacerbate social discontent and even political instability within communities.
People Affected by Unemployment
When a family member is unemployed, their lives and financial stability are frequently disrupted. Furthermore, the negative effects of unemployment might extend to diverse groups such as job searchers, who face difficulties in getting steady employment and financial stability (Madsen & Mikkelsen, 2022). In other cases, an entire community might suffer as high unemployment rates lead to diminishing economic prospects, negatively impacting the area’s general well-being.
Significance of the Data
The employment figures for August 2023 show a mixed picture. Nonfarm payroll employment rose marginally, but growing unemployment implies labor market concerns. Healthcare, recreation, and social assistance all experienced employment increases, boosting overall employment. However, declines in transportation and warehousing jobs, as well as negative adjustments to previous statistics, indicate possible job market vulnerabilities.
Reflection
This research study gives useful insights on the labor market trends in August 2023. It emphasizes the necessity of looking beyond the headline unemployment number to the subtleties among various demographic groups and industries. The research emphasizes the need for policymakers to handle unemployment holistically, taking into account economic, social, and psychological issues in order to establish a more resilient and inclusive job market.
The Inflation Rate
CPIU Comparison
The month and year are August 2023, and the Consumer Price Index for All Urban Consumers (CPI-U) level is 307.026. This figure indicates the relative cost of a set basket of products and services purchased by the average urban consumer in the United States. The CPI-U is expressed as a percentage of a base period set at 100.
Inflation from Last Month
The CPI-U was 305.691 in July 2023, and it rose to 307.026 in August 2023. Therefore, inflation rate:
= Inflation rate = ((307.026 – 305.691) / 305.691) x 100
= 0.44%
As a result, this rate when related to the July shows a very minor rise in the overall price levy.
Inflation from the Last 12 Months
To compute the rate of inflation for the past 12 months for “all items,” data from Table 1 for August 2023 was used, which was then compared to the CPI-U for August of the prior year (August 2022). The CPI-U was 307.026 in August 2023, and 296.171 in August 2022. The rate of inflation over the preceding 12 months is calculated as follows:
= (307.026 – 296.171) x 100
= 3.66%
Categories of Goods or Services with Greatest Increase
- Motor vehicle (19.1%) (Greatest)
- Motor vehicle maintenance and repair (12.0%). (Greatest )
Categories of Goods or Services with Lowest Increase
- Commodities less food and energy commodities (0. 2%)
- Physician’s services (0.3%).
Categories of Goods or Services with Decrease
- Utility (Piped) gas service (-16.5%)
- Fuel oil (-14.8%).
People who Loses from Inflation
- Individuals on fixed incomes, such as retired people, may struggle to maintain their level of life as inflation erodes the actual value of their income, making it more difficult to afford growing costs.
- Savers: People who save in traditional accounts may lose buying power over time since the income generated may not keep up with growing costs.
People who Benefits from Inflation
- Debtors: Inflation benefits borrowers by lowering the actual burden of their fixed-rate debt, allowing them to repay loans with less valued future dollars.
- Asset Owners: Individuals who own assets such as real estate or stocks might gain from inflation since the value of these assets frequently rises in tandem with rising prices.
Data Importance
Table 1 gives critical statistics on the CPI-U in August 2023, revealing inflationary pressures in the US economy. This information is extremely important since it influences monetary policy choices, consumer spending and investment plans, and corporate operations.
Reflection
This report has shown the importance of economic statistics, notably the CPI-U, in comprehending inflation and its broad implications. CPI-U data, I have found, is critical for individuals, businesses, governments, and investors to make educated decisions in a variety of economic areas.
Unemployment Data by Labor Force Groups and Duration
Three Labor Force Groups
Educational Attainment
Duration of unemployment
Report on the Analysis Results
Unemployment Percentages
As shown in Table 1, the greatest redundancy rate was 9.6% in 2010 and the least was 3.6% in 2022. The greatest joblessness rates for males (20 and up) were in 2010 (9.8%), and the base for women (20 and over) were in 2011 (7.9%). In contrast, the bottom rate of unemployment for males were in 2000 (3.3%), while the minimum for women were in 2019 (3.3%) and 2022 (3.3%). In recent years, the connection has been distinguished by a period of economic stability and recovery, as well as decreasing unemployment rates across genders and age categories.
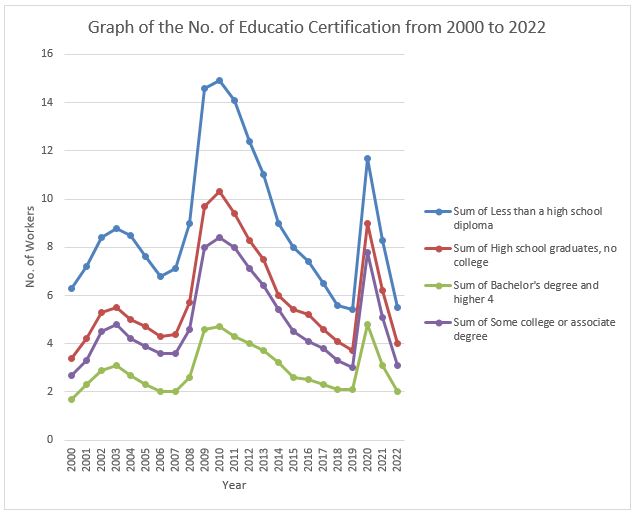
Educational Accomplishment
From Table 2, individuals with no high school diploma had the peak unemployment rate in 2010 (14.9%) and lowermost in 2022 (5.5%). High school graduates with no college education had the greatest percentage (10.3%) in 2010, but the bottommost rate (3.4%) in 2000. The category of some college or associate degree had the greatest rate in 2010 (8.4%), but the base rate in 2000 (2.7%). The maximum rate in the bachelor’s degree or above category was in 2010 (4.7%), while the ground rate was in 2000 (1.7%). In terms of relationships, these individuals had rates of not more than 5% throughout the majority of the years studied, even during economic downturns.
Duration in Weeks
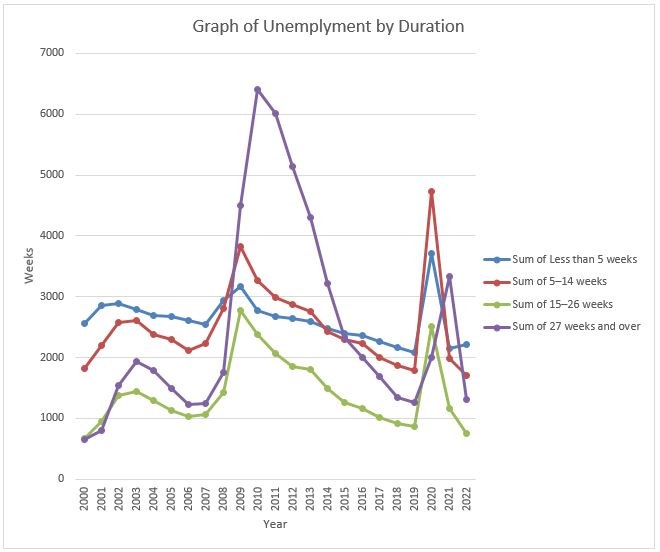
According to Table 3, the years with the longest periods of unemployment were 2010 (14,825) and 2000 (5,692). In the <5 weeks category, the highest and lowest rates were 3,708 in 2000 and 2,558 in 2020, respectively. In the 5-14 weeks category, the peak and minimum rates were 4,728 in 2000 and 1,815 in 2020, respectively. In the 15-26 week category, the longest length was 2,516 weeks in 2020 and the shortest was 669 weeks in 2000.
Among those aged 27 and over, the ground rate was 649 in 2000 and the greatest was 6,415 in 2020. During these years, prolonged unemployment benefits gave a lifeline to many who were unable to find job. Conversely, the years with the low unemployment duration were 2000 and the years with the longest unemployment length were 2020, showing a stronger labor market and an economic crisis caused by COVID-19, respectively.
Implications
Teenagers may have greater unemployment rates than adults. According to Parolin and Lee (2022), the growing number of teenagers may lead to a minor increase in total unemployment. With a growing minority population, initiatives to decrease racial and ethnic inequities in job prospects are becoming increasingly important in order to ensure economic justice.
Significance
This exercise’s data emphasizes the dynamic character of the US job market during the last two decades. It emphasizes the relevance of education in lowering the danger of unemployment as well as the influence of economic downturns on unemployment rates. The data also stresses the significance of public policy in alleviating the consequences of economic crises, as seen by the protracted length of unemployment during the global financial crisis and the pandemic.
Reflection on the Report
This experiment reinforced the notion that unemployment is a complicated problem driven by a variety of factors such as financial conditions, education, and demography. It emphasizes the significance of specialized policies to meet the requirements of various demographic groups and achieve inclusive monetary growth. The exercise also emphasizes the need of using historical data to analyze patterns and make educated decisions about workforce development, education, and economic policy.
Conclusion
In conclusion, this report explored the unemployment and inflation rates, as well as the intricate patterns within labor force groups and duration from 2000 to 2022. It has offered a multifaceted understanding of the dynamic forces shaping the U.S economic landscape. As such, government agencies should reflect on the intricate web of data and its implications, noting the vital role these insights play in fostering economic stability.
References
Employment situation summary. (2023). U.S. Bureau of Labor Statistics. Web.
Madsen, J. K., & Mikkelsen, K. S. (2022). How salient administrative burden affects job seekers’ locus of control and responsibility attribution: Evidence from a survey experiment. International Public Management Journal, 25(2), 241-260. Web.
Maisch, D. J. (2022). Can money buy you mental health? The effects of economic and non-economic factors on mental health. The Park Place Economist, 29(1), 1-23. Web.
Parolin, Z., & Lee, E. K. (2022). Economic precarity among single parents in the United States during the COVID-19 pandemic. The ANNALS of the American Academy of Political and Social Science, 702(1), 206-223. Web.
Wiertz, D., & Lim, C. (2019). The civic footprints of labor market participation: Longitudinal evidence from the United States, 2002–2015. Social Forces, 97(4), 1757-1784. Web.