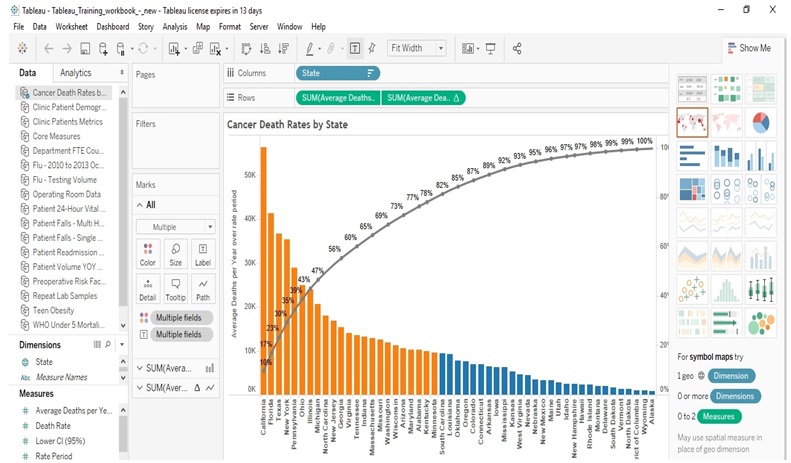
Pareto Chart
Answers for Flipgrid Video
In clinical settings, the creation of Pareto charts may be useful for understanding the impact of factors affecting one or another health problem. Since these factors are arranged in descending order, it becomes evident which of them requires more attention from nurses. The care team may concentrate its attention on specific areas, and leaders may direct their employees by communicating the rationale for targeting critical issues. According to Harel et al. (2016), the Pareto chart is a valuable improvement tool that can contribute to quality care outcomes. This tool allows breaking a problem into several parts and resolving it systematically by focusing on the most significant factors that cause it. In addition, it may be applied to using limited resources in a more effective manner. For example, when there is limited funding to support people with chronic diseases, the Pareto chart will show the most vulnerable categories.
In my practice, I can use the Pareto chart to analyze the factors that are the most significant in causing such chronic diseases as obesity, diabetes, and cardiovascular issues in the Hispanic population. There is a range of factors, but the preparation of this chart is likely to structure them to direct the attention. Also, it is possible to measure the effect of treatment options on patients’ health, be it some medication or an intervention associated with the communication. Nutrition, physical activity, methods of coping with stress, and other strategies may be included in the chart and analyzed. Each of the factors may be evaluated in terms of time, costs, expected outcomes, et cetera. Thus, I can improve the very approach to treatment and disease prevention by reinventing a problem’s vision.
References
Harel, Z., Silver, S. A., McQuillan, R. F., Weizman, A. V., Thomas, A., Chertow, G. M.,… Bell, C. M. (2016). How to diagnose solutions to a quality of care problem. Clinical Journal of the American Society of Nephrology, 11(5), 901–907.