Value stream mapping is a crucial lean tool that helps to evaluate the current wastes in the production process and design process improvement interventions to improve the process efficiency. A value stream map (VSM) visualizes all the stakeholders and processes needed to fulfill the order from a customer. The present paper provides a VSM of the fruit and vegetable distribution process. The paper briefly overviews the process, calculates the current process cycle efficiency (PCE%), identifies wastes, suggests process improvements, and estimates the PCE% after improvements.
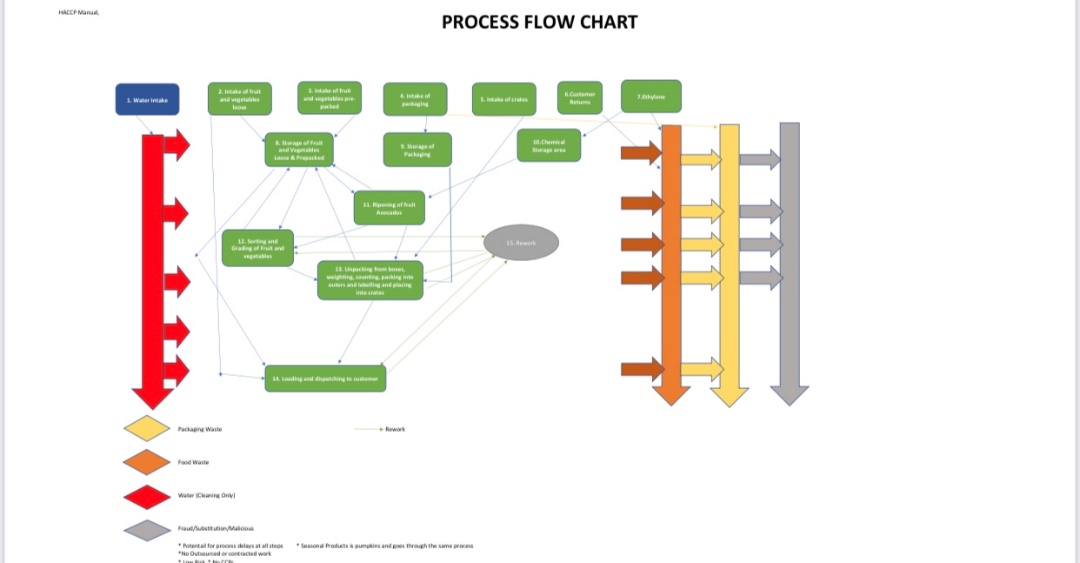
The current process flow chart is demonstrated in Figure 1 below. According to the flow chart, there several crucial process steps needed to deliver the product to the customer. First, the company needs to intake all the raw materials, including fruit and vegetables, packaging, crates, and ethylene. Second, fruit and vegetables are sent to ripening with the help of ethylene. Third, all the fruit and vegetables need to be sorted and graded. Fourth, the company needs to unpack, count, repack, label, and put all the products inside crates. Finally, all the products are shipped to the customer.
While the process is standard for all the companies in the industry, it may be associated with significant wastes. The current VSM provided in Figure 2 below makes those wastes easy to identify. The VSM revealed that the current lead time is 332 hours (13.84 days), the cycle time (CT) is 232 hours, and the value-added (VA) CT is 150 hours. The PCE% can be calculated by dividing the VA CT by the lead time. Thus:

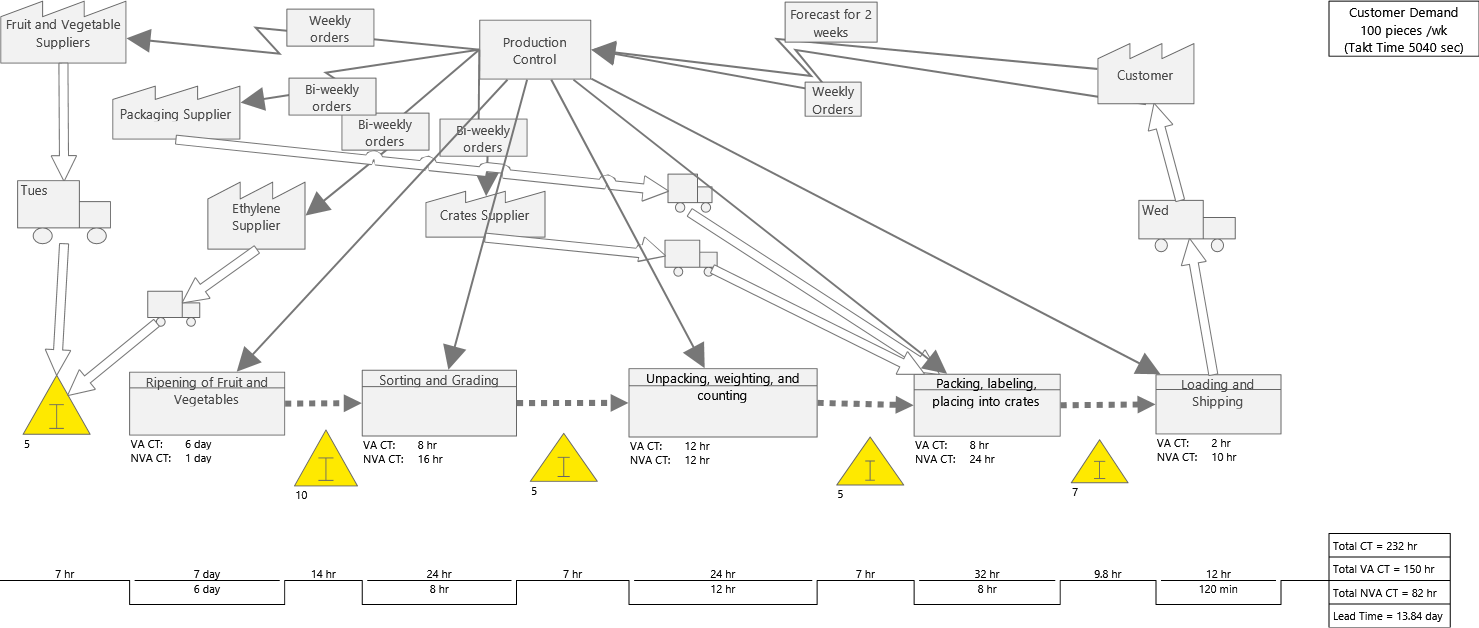
According to Figure 2, there are several areas of improvement that can be identified. First, the ripening process generates around 24 hours of waste, which is more than 13% of all wastes. The problem is associated with the fact that fruit and vegetables ripe at different speeds, which implies that employees need to check for ripe fruit and vegetables systematically.
Currently, the fruit and vegetables are checked once in the morning. Since the warehouse works 24 hours a day, the frequency of checks can be increased to reduce wastes associated with unneeded time allocated to ripening by 50%. Such an improvement can reduce the non-value-added (NVA) of the process by 12 hours.
Second, the current sorting process is also imperfect, as it generates 16 hours of NVA CT. The central problem is that the current automatic sorting machine is very old, which creates many issues with efficiency. Thus, it is crucial to replace the automatic sorting machine. Such an improvement can reduce the NVA CT of the process to 4 hours.
Finally, the packing, labeling, and putting into crates is currently very slow due to the problems with the suppliers. In particular, the suppliers come at different times of the week from different places, which causes problems with scheduling. Additionally, the packaging material is often of low quality. Thus, the company should find a supplier that can provide both crates and packages of improved quality. This can reduce NVA CT from 24 hours to 6 hours.
While there are other areas of improvement, such as inventory exchange time and shipping time, the company should focus on these three initiatives to reduce wastes. These improvements will reduce the lean time to 290 hours and the cycle time to 190 hours, which will improve the PCE% to 51.72%.