Introduction
With information technology taking the centre stage of most organizations and companies alike, system analysis and design is a task that has become a necessary requirement for the 21st century businesses. Companies are now more than ever interested in understanding how information is flowing through their systems. To be able to understand a system, one must be able to understand its functions including data flowing through the system. Some systems are complex consisting of several external entities and processes. A system analyst thus has to come up with a visual representation of the system, which clearly illustrates the various processes, external entities, data flows, and data stores within the system. But how can this be achieved? The solution is data flow diagram (DFD), which is able to provide a visual illustration map of how data flows through a system (Shelly, Cashman, & Rosenblatt, 2009). In structured analysis, data flow diagram provides a necessary tool for visualizing data processing within a system. DFD is a graphical design model that provides a flowchart of data including the type and source of input data, how it flows through the system and where it is stored, and the type of output data (Kendall & Kendal, 2010). Unlike other tools of structured analysis, DFD does not provide information on the type of data circuit as well as the timing of processes.
Given a well defined system and its information requirements, DFD represents data acquisition, transformation, storage, and delivery processes (March, n.d). From this introduction, everyone would conclude that DFD provides a necessary tool for structured-system analysis and design. But how appropriate is DFD as a model for system analysis and design? This essay, therefore seeks to answer this question by undertaking a thorough research on the topic. The essay provides a general description of DFD including its components and guiding rules and goes a notch higher to assess its appropriateness as a tool for system analysis and design. The essay relies on the findings of previous studies to support important points and finally synthesizes all information to come up with an objective conclusion.
Components of a data flow diagram
The flow of data within a system goes through a number of components constituting the data flow diagram. The main components of a DFD are categorized into: process, flow, store, and terminator/external entity.
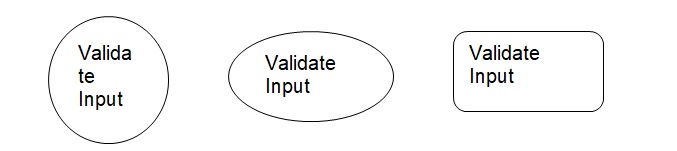
The process component of a DFD represents part of the information system that transforms input into output (Shelly, Cashman, & Rosenblatt, 2009). It is this component that determines the quality of the output since it changes raw data into useful information depending on the rule of the business. Processes are basically computer aided data transformation processes that follow processing logic of a computer programming language (March, n.d). In a data flow diagram, the standard graphical symbol of a process is a circle. However, some system analysts may use an oval, a rectangle with rounded edges or even a rectangle (Shelly, Cashman, & Rosenblatt, 2009). The process is often labeled with a name describing its function. This can either be a single word, a phrase or even a simple sentence as shown in figure 1 below.
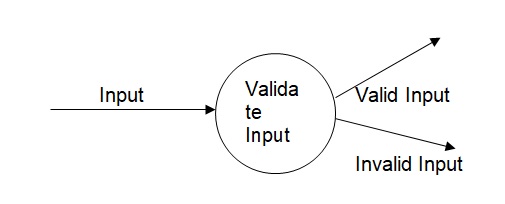
Another important component of a DFD is the flow. Graphically represented by an arrow, the flow in a DFD symbolizes data in motion including bits, messages, floating point numbers, and character (Kendall & Kendal, 2010). The flow represents the movement of data in a system either as input chunks or output packets (Kendall & Kendal, 2010). Data is either moved as input from the store to the process for transformation or as output from the process to the terminator or back to the store as illustrated in figure 2 below. While the process is only associated with computerized systems, the flow can as well represent data movement between computerized and non-computerized systems (Shelly, Cashman, & Rosenblatt, 2009). This is possible when either the chunks or packets are physical materials.
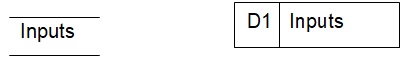
Whereas the flow represents data in motion, the store represents data at rest (Kendall & Kendal, 2010). Graphically represented by two parallel lines, the store is an inventory of data within the system when the process is inactive (March, n.d). Some analysts may prefer to use a narrow rectangle as shown in figure 3 below. In a computerized system, the store represents files and databases. However, the store also represents hard copy data files, or other electronic data forms stored in devices such as memory cards, memory sticks, CDs among others. Just like the flow, no data transformation takes place in the store. In a DFD, the store is labeled using the name of data packet it stores, but is usually written in plural.
The last component of a DFD is the terminator/ external entity. Graphically symbolized as a rectangle, the terminator represents external entities, which the system interact with either by acquiring input or delivering output as shown in figure 4 below. In a system, the terminator can either be an individual, a group of people, an organization or even a department within an organization, but it has to be outside the system being modeled (Kendall & Kendal, 2010). While it is possible for a system analyst to change the contents of the store without manipulating data, it is impossible to manipulate the contents of the terminator.
Figure 4 below illustrates a simple example of a DFD showing how its components interact.
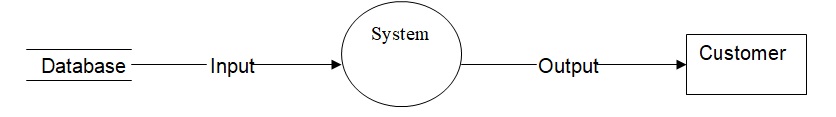
In this diagram, the labeled circle represents the process/function, the parallel lines represent data store, the labeled arrows represent data flow, and the labeled rectangle represents external entity. In summary, this diagram gives a graphical illustration of how data flows from the database to the system for processing and finally to the customer. While the illustration in figure 4 above may appear to be very simple, DFDs can at times be very complex constituting of so many levels. This thus requires adherence to some rules while constructing DFD as discussed in the next section of this essay.
Rules for data flow diagram
The rules for DFD are simple and in plain English (Ibrahim & Yen, 2011). There are eight fundamental rules for a DFD. Rule 1 states that a DFD must consist of a process, a flow, a data store, and a terminator/external entity (Ibrahim & Yen, 2011). The graphical symbols for DFD components must be standard and consistent. For instance, if an analyst decides to use a circle to symbolize process, then this must be consistent throughout the DFD. Rule 2 provides a general guidance for drawing the DFD. The rule states that: data must only flow in one direction; data flows to terminators must come from processes; data input to stores must only come from processes; output to data stores must only go to processes; and output data flows must be labeled different from input data flow (“Data flow diagrams”, 2005). Rule 3 on the other hand provides guideline for naming and states that DFD components must be named uniquely as follows: a verb or phrase for the process; and descriptive noun for the data flow, store and terminator/external entity (Ibrahim & Yen, 2011). Rule 4 and 5 are more concerned with consistency stating that data sets in a DFD must be consistent. Rule 6 provides guideline for decomposition of processes in a DFD and states that a process of the parent DFD must be wholly described by the processes of its children DFD (Ibrahim & Yen, 2011). Rule 7 provides guideline for balancing several DFD level. The rule states that every data flow, store, and external entity in a higher level DFD must be present in the preceding lower level DFD (Ibrahim & Yen, 2011). Finally, Rule eight provides guidelines for data movement from data stores. The rule states that there must be no data movement between stores and data from a store must only flow to a process.
Most researchers have observed that the rules for data flow diagrams lack formal language for semantic specification (Ahmed et al., 2008; Leavens, Wahls & Bakar, 1999; Tong & Tang, 1991). However, there are automated verification CASE tools that are able to detect if a DFD is inconsistent or incomplete with regard to the above stated rules (Ibrahim & Yen, 2011). Consistency is thus an important rule that any system analyst cannot underrate. As Dixit et al (2008) observed, consistency denotes uniformity of system specifications at all DFD levels. While it is possible to manually, check for consistency in a DFD, the exercise is tedious especially when the model consists of several DFD levels. In order to find a solution, a number of researchers have attempted to come up with verification CASE tools in a bid to providing a formalized specification for DFD. In this regard, Ibrahim & Yen (2011) attempt to provide a formal model on formal notations used for DFD rules. The authors provide a formal model based on mathematical notation. The model is more of a programming tool that is able to automatically check for inconsistencies within a DFD.
The appropriateness of DFD as a tool for system analysis and design
The appropriateness of DFD as a tool for system analysis and design lies in its ability to give a visual picture of what goes on within the system and its boundaries. During system analysis or design, software engineers often conceptualize the system into a visual model that is easy to study and understand. Data flow diagram serves as graphical conceptualization representing the analyst’s perception of how data flows through the system. Apart from increasing the analyst’s understanding of the system under study, DFD also serves other important purposes including: providing a model for system design; illustrating communication channels between system developers and users; and capturing system requirements for future maintenance purposes (Kendall & Kendal, 2010).
The strengths of DFD also adds to its appropriateness a tool for system analysis and design lies in its strengths. To begin with, a DFD is easy to understand and implement. In this regard, Millet and Nelson (2007) conducted a study on students’ perception of data flow diagrams vs. use cases. Their findings indicate that students perceive DFDs to be easy to understand and use. Their study also revealed that DFD provides a graphical model for better understanding of the communication between a system and its users (Millet and Nelson, 2007). A data flow diagram summarizes the complex details of system’s processes, boundaries, and data entities into a simple graphical model that is easy to conceptualize (Kendall & Kendal, 2010). By documenting this information, system analysts are able to visualize alternative high level data flow diagrams hence a necessary tool in system design. In other words, data flow diagrams provide a necessary foundation for high level modeling and design of the system under study (Kendall & Kendal, 2010). At ‘level 1’ or top level DFD, the entire system is portrayed as a single diagram. As many processes are incorporated in the system, the levels increase hierarchically. As some analysts argue, DFDs provide a tool for implementing the waterfall model of system design (Shelly, Cashman, & Rosenblatt, 2009). As the DFD increase in hierarchy, some of the bottom level processes are decomposed to many less complex processes. This aids in ensuring that the DFD remains as simple and easy to comprehend as possible. Besides, decomposing the processes provides a bottom-up approach to system design allowing for fast detection and correction of malfunctioning processes. Last but not least, unlike most system analysis models, a DFD is able to capture even parallel processes making it easier for system analysts to study the whole system as a single unit.
Despite its many advantages, DFDs also have some weaknesses. There is widespread concern that users often confuse DFDs with process flowcharts hence may lead to poor analysis of the system (Shelly, Cashman, & Rosenblatt, 2009). DFDs are interpreted differently by different users and analysts hence do not provide a standardized representation of the system. Besides, the construction of a DFD is a computerized process driven task, which can overlook important processes or data elements in the system. Data flow diagrams do not give any information on missing elements and may lead to wrong conclusions on the system under study. Moreover, the construction of a DFD requires appropriate software without which it becomes too difficult for a system analyst to do the same.
Conclusion
From this discussion, a conclusion can be drawn that DFD is a necessary tool in structured system analysis and design. Data flow diagram not only provides a tool for visualizing a system including its processes and data flows, but also provides a significant model for bottom-up approach to system modeling. While there are many guiding rules for constructing DFD, a verification tool is equally important to check whether or not all the rules are adhered to. Available literature points to the need for a standardized verification tool for consistency in the DFD.
References
Ahmed Jilani, A. A., Nadeem, A., Kim, T. H. and Cho, E. S. (2008). Formal representations of the data flow diagram: A survey. Proc. of the 2008 Advanced Software Engineering and Its Applications. Washington, USA: IEEE Computer Society. pp. 153-158.
Data flow diagram. (2005). Web.
Dixit, J. B. and Kumar, R. (2008). Structured system analysis and design (Paperback ed.). New Delhi, India: Laxmi Publisher.
Kendall, K. E. & Kendal J.E. (2010). System analysis and design (8th ed.). Upper Saddle River, NJ: Prentice Hall
Leavens, G.T., Wahls, T. and Bakar, A.L. (1999). Formal semantics for SA style data flow diagram specification languages. Proceedings of the 1999 ACM Symposium on Applied Computing. Oregon, US: IEEE Computer Society. pp. 526–532.
March, T (n.d). Process Modeling. n.p. Web.
Millet, I. & Nelson, R. (2007). Data flow diagrams vs. use cases- student perceptions. International Journal of Information and Communication Technology Education, Vol. 3 (1), pp. 70-78.
Shelly, G.B., Cashman, T. J. & Rosenblatt, H. J. (2009). System analysis and design (8th ed.). Stanford, Connecticut, USA: Cengage Learning.
Tong, L. and Tang, C.S. (1991). Semantic specification and verification of data flow diagrams. Journal of Computer Science and Technology, 6(1), pp. 21-31.