Which Country Has Better Education: Australia or USA?

Abstract

What comports a quality education? Is it just the first rate grades one gets on paper upon graduating, or is it more holistic? Is a university education worth getting at any price, even if it means the student will have loans to pay for years to come? With these questions in mind, the paper will try to weigh the pros and cons and determine whether it is better to pursue an undergraduate degree in The United States or look for greener pastures abroad, specifically Australia.

Introduction

There are stringent guidelines in place today for young people who want to get an opening in the highly competitive job market. The first of these qualifications is having a sound educational background, preferably up to university level. However, though education from elementary to high school level in the United States and Australia is largely subsidized by the government and is thus affordable, college is another kettle of fish.

First impression given in numbers

By 2002, Australia had forty five major public institutions of higher learning and a further eighty five private ones which catered to the needs of the 750,000 plus students. 75% of these students were undergraduates and 21% were doing their postgraduate studies (Breen, 2002).

Australia also caters to international students who by 2002 made up 14% of the student population in Australian universities. Majority of these students come from the Asian countries Hong Kong, Singapore, Malaysia, India and Indonesia (Breen, 2002).

Breen (2002) notes that there has been a decline in student/ faculty ratio that might compromise the quality of education in Australian universities from 1/12 in 1980 to 1/19 in 2000.

Equity and access policies: Financial assistance; Grants, scholarships and interest rates on student loans

Clearing high school does not automatically mean that a student gets into an institution of higher learning. There are the two fundamental questions: will I get an opening at a university and if I do, will I be able to afford going there? These are questions that students in both Australia and the US ask themselves year in year out.

In his paper ‘Fairness, Fees and Equity in Higher Education’, Professor Glyn Davis, the Vice chancellor of the University of Melbourne tackles the Australian aspect of this question. Professor Davis points out that the question asked by aspiring students cover issues relating to the number of places available at Australian universities, subsidies made in tuition, price control and student income support.

In both countries, students have to pay for higher education. However, as noted by Davis (2007), there was a brief period between 1979 and 1988 when university education in Australia was free. According to Davis (2007), the OECD rankings named Australia as being one of the most expensive places to pursue a university education. However, it is still not as expensive as the U.S, where the average tuition fees paid by students in 2006 stood at 6,988 Australian dollars, and tuition fees in Australia stood at 6,030 Australian dollars (Davis, 2007). Davis also notes that Australia introduced a funding scheme for its students in 1989; the Higher Education Contribution Scheme (HECS) was a way of ensuring that students failed to get a university education just because they could not afford it.

After the research done by the Centre for the Study of Higher Education at the University of Melbourne in 2007 in regards to students falling in the low socio-economic standing (SES) and the limitations that they face in pursuing a higher education, it was determined that there was a distinct relation between the two. (Universities Australia Equity and Participation Action Plan (UAEPAP), 2007). Their percentages show a minimal number of SES proceeding to institutions of higher learning with only 9% of the 12.8% who make urban SES attending universities and 5.9% of rural SES out of the 10.6 proceeding to universities. The research showed that the chances are three times greater for a student coming from high SES to go to university as compared to someone from a low SES background (UAEPAP, 2007).

To promote equity, the Australian government worked on policies that would favor lower SES. One of the outcomes was the formulation of the HECS mentioned by Professor Davis.

Funding for Australian university students comes from different sources, the bulk, and 61% being done by the Australian government, HECS subsidies covering 2.9% (Commonwealth of Australia, 1999)

An issue that Australian universities has had to contend with is the rapid growth in the number of students who want to join, especially after the world war tow and another leap once the HECS subsidization was introduced. Since HECS subsidization is enabled by the taxation of average citizens, the argument is that there is no need for someone who will not benefit from a university education to pay for it. That is how the Australian government formulated higher taxation for graduates, who say are in a better position to earn more than their high school level counterparts. The rate of taxation is refined to the type of employment of the graduate and the sex since there are some occupations where one earns more money and men are generally paid higher wages than women (Commonwealth of Australia, 1999).

Table A-1: Applications, Offers, Acceptances and Unmet Demand Time Series, 2001-2008 (Australian Universities). From the Australian Government: Department of Education, Employment and Workplace Relations.
2001 2002 2003 2004 2005 2006 2007 2008
NEW SOUTH WALES AND AUSTRALIAN CAPITAL TERRITORY
Applications ‘On-time’ Applications (Sept) 59,867 64,924 66,925 69,473 67,296 66,415 67,137 66,783
Total Applicants (Feb) 70,841 76,182 77,700 78,789 76,519 75,939 77,794 79,228
Final Applicant Count (March) 76,782
Eligible Applicants (March) 64,597 69,336 71,467 71,467 67,778 67,781 68,769 69,073
% of Total Applicants ‘On-time’ 84.5% 85.2% 86.1% 88.2% 87.9% 87.5% 86.3% 84.3%
% Change in Eligible Applicants on Previous Year 7.3% 3.1% 0.0% -5.2% 0.0% 1.5% 0.4%
Offers ‘Main Round’ Offers (Jan) 54,420 53,235 52,888 51,129 56,927 58,353 60,302 61,671
Total Receiving Offer (Feb) 55,907 55,789 55,286 53,505 59,261 60,731 63,056 64,224
Final Receiving Offer (March) 62,565
Eligible Receiving Offer (March) 54,407 54,180 53,797 51,603 56,522 58,213 60,082 60,462
Unsuccessful Eligible Applicants 10,190 15,156 17,670 19,864 11,256 9,568 8,687 8,611
% Total Offers made during ‘Main Round’ 97.3% 95.4% 95.7% 95.6% 96.1% 96.1% 95.6% 96.0%
% Total Receiving an Offer 78.9% 73.2% 71.2% 67.9% 77.4% 80.0% 81.1% 81.1%
% Eligible Receiving an Offer 84.2% 78.1% 75.3% 72.2% 83.4% 85.9% 87.4% 87.5%
% Change in Eligible Applicants Receiving an Offer on Previous Year -0.4% -0.7% -4.1% 9.5% 3.0% 3.2% 0.6%
Acceptances Final Accepting Offer (March) 34,218
Eligible Accepting Offer (March) 34,901 35,900 43,557 40,906 44,818 37,241 40,731 33,027
% Eligible Accepting Offer 64.1% 66.3% 81.0% 79.3% 79.3% 64.0% 67.8% 54.6%
Rejection Rate (%) 35.9% 33.7% 19.0% 20.7% 20.7% 36.0% 32.2% 45.4%
% Change in Eligible Accepting their Offer on Previous Year 2.9% 21.3% -6.1% 9.6% -16.9% 9.4% -18.9%
Unmet Demand Estimated Eligible Applicants Not Receiving an Offer After Discounting 3,300 6,600 10,000 11,400 5,700 3,700 3,400 2,500
% of Eligible Applicants (Unmet Demand) 5.1% 9.5% 14.0% 16.0% 8.4% 5.5% 4.9% 3.6%
% Difference in Estimated Unmet Demand on Previous Year 4.4% 4.5% 2.0% -7.6% -2.9% -0.6% -1.3%
VICTORIA
Applications ‘On-time’ Applications (Sept) 52,229 57,616 59,872 59,925 58,676 56,141 58,149 56,468
Total Applicants (Feb) 58,140 65,422 64,919 64,073 62,201 60,420 63,912 62,849
Final Applicant Count (March) 60,672
Eligible Applicants (March) 55,053 59,785 61,649 60,312 58,907 51,778 54,957 52,476
% of Total Applicants ‘On-time’ 89.8% 88.1% 92.2% 93.5% 94.3% 92.9% 91.0% 89.8%
% Change in Eligible Applicants on Previous Year 8.6% 3.1% -2.2% -2.3% -12.1% 6.1% -4.5%
Offers ‘Main Round’ Offers (Jan) 42,031 40,856 40,224 41,629 46,300 46,994 44,748 43,854
Total Receiving Offer (Feb) 48,378 46,666 46,721 47,737 52,725 51,379 45,924 45,217
Final Receiving Offer (March) 43,512
Eligible Receiving Offer (March) 39,575 38,153 38,118 37,961 41,457 41,310 43,140 41,804
Unsuccessful Eligible Applicants 15,478 21,632 23,531 22,351 17,450 10,468 11,817 10,672
% Total Offers made during ‘Main Round’ 86.9% 87.5% 86.1% 87.2% 87.8% 91.5% 97.4% 97.0%
% Total Receiving an Offer 83.2% 71.3% 72.0% 74.5% 84.8% 85.0% 71.9% 71.9%
% Eligible Receiving an Offer 71.9% 63.8% 61.8% 62.9% 70.4% 79.8% 78.5% 79.7%
% Change in Eligible Applicants Receiving an Offer on Previous Year -3.6% -0.1% -0.4% 9.2% -0.4% 4.4% -3.1%
Acceptances Final Accepting Offer (March) 36,416
Eligible Accepting Offer (March) 29,125 27,509 27,397 27,320 24,619 31,825 34,742 34,708
% Eligible Accepting Offer 73.6% 72.1% 71.9% 72.0% 59.4% 77.0% 80.5% 83.0%
Rejection Rate (%) 26.4% 27.9% 28.1% 28.0% 40.6% 23.0% 19.5% 17.0%
% Change in Eligible Accepting their Offer on Previous Year -5.5% -0.4% -0.3% -9.9% 29.3% 9.2% -0.1%
Unmet Demand Estimated Eligible Applicants Not Receiving an Offer After Discounting 7,000 10,100 12,400 12,000 6,500 4,300 5,100 4,500
% of Eligible Applicants (Unmet Demand) 12.7% 16.9% 20.1% 19.9% 11.0% 8.3% 9.3% 8.6%
% Difference in Estimated Unmet Demand on Previous Year 4.2% 3.2% -0.2% -8.9% -2.7% 1.0% -0.7%
QUEENSLAND
Applications ‘On-time’ Applications (Sept) 39,976 41,148 42,427 42,545 39,744 40,538 39,454 37,898
Total Applicants (Feb) 47,841 49,789 50,347 49,839 47,380 49,004 48,760 48,785
Final Applicant Count (March) 48,228
Eligible Applicants (March) 52,893 54,645 55,350 54,155 49,759 52,039 46,880 46,822
% of Total Applicants ‘On-time’ 83.6% 82.6% 84.3% 85.4% 83.9% 82.7% 80.9% 77.7%
% Change in Eligible Applicants on Previous Year 3.3% 1.3% -2.2% -8.1% 4.6% -9.9% -0.1%
Offers ‘Main Round’ Offers (Jan) 36,998 36,021 34,895 36,436 37,961 38,712 39,078 37,831
Total Receiving Offer (Feb) 40,241 38,584 36,732 37,514 39,318 40,930 41,628 41,010
Final Receiving Offer (March) 41,241
Eligible Receiving Offer (March) 42,843 42,689 40,588 40,993 42,775 44,947 41,561 40,927
Unsuccessful Eligible Applicants 10,050 11,956 14,762 13,162 6,984 7,092 5,319 5,895
% Total Offers made during ‘Main Round’ 91.9% 93.4% 95.0% 97.1% 96.5% 94.6% 93.9% 92.2%
% Total Receiving an Offer 84.1% 77.5% 73.0% 75.3% 83.0% 83.5% 85.4% 84.1%
% Eligible Receiving an Offer 81.0% 78.1% 73.3% 75.7% 86.0% 86.4% 88.7% 87.4%
% Change in Eligible Applicants Receiving an Offer on Previous Year -0.4% -4.9% 1.0% 4.3% 5.1% -7.5% -1.5%
Acceptances Final Accepting Offer (March) 36,631
Eligible Accepting Offer (March) 34,938 34,950 32,898 33,271 37,242 39,555 36,448 36,371
% Eligible Accepting Offer 81.5% 81.9% 81.1% 81.2% 87.1% 88.0% 87.7% 88.9%
Rejection Rate (%) 18.5% 18.1% 18.9% 18.8% 12.9% 12.0% 12.3% 11.1%
% Change in Eligible Accepting their Offer on Previous Year 0.0% -5.9% 1.1% 11.9% 6.2% -7.9% -0.2%
Unmet Demand Estimated Eligible Applicants Not Receiving an Offer After Discounting 4,800 5,600 9,400 8,400 4,200 4,000 2,700 3,200
% of Eligible Applicants (Unmet Demand) 9.1% 10.2% 17.0% 15.5% 8.4% 7.7% 5.8% 6.8%
% Difference in Estimated Unmet Demand on Previous Year 1.1% 6.8% -1.5% -7.1% -0.7% -1.9% 1.0%
SOUTH AUSTRALIA AND NORTHERN TERRITORY
Applications ‘On-time’ Applications (Sept) 16,411 17,146 18,621 20,359 19,838 18,815 19,597 19,109
Total Applicants (Feb) 20,284 20,999 24,619 25,682 24,668 22,657 23,989 23,712
Final Applicant Count (March) 24,696
Eligible Applicants (March) 14,915 15,359 15,577 15,442 19,704 22,810 23,165 22,915
% of Total Applicants ‘On-time’ 80.9% 81.7% 75.6% 79.3% 80.4% 83.0% 81.7% 80.6%
% Change in Eligible Applicants on Previous Year 3.0% 1.4% -0.9% 27.6% 15.8% 1.6% -1.1%
Offers ‘Main Round’ Offers (Jan) 15,266 14,136 16,409 17,263 17,217 16,741 17,067 16,517
Total Receiving Offer (Feb) 17,006 16,100 18,619 18,463 18,398 17,852 18,115 17,692
Final Receiving Offer (March) 19,731
Eligible Receiving Offer (March) 13,261 13,429 12,759 12,577 16,479 19,222 19,551 19,238
Unsuccessful Eligible Applicants 1,654 1,930 2,818 2,865 3,225 3,588 3,614 3,677
% Total Offers made during ‘Main Round’ 89.8% 87.8% 88.1% 93.5% 93.6% 93.8% 94.2% 93.4%
% Total Receiving an Offer 83.8% 76.7% 75.6% 71.9% 74.6% 78.8% 75.5% 74.6%
% Eligible Receiving an Offer 88.9% 87.4% 81.9% 81.4% 83.6% 84.3% 84.4% 84.0%
% Change in Eligible Applicants Receiving an Offer on Previous Year 1.3% -5.0% -1.4% 31.0% 16.6% 1.7% -1.6%
Acceptances Final Accepting Offer (March) 14,021
Eligible Accepting Offer (March) 12,570 13,080 12,352 12,148 11,992 13,968 14,058 13,715
% Eligible Accepting Offer 94.8% 97.4% 96.8% 96.6% 72.8% 72.7% 71.9% 71.3%
Rejection Rate (%) 5.2% 2.6% 3.2% 3.4% 27.2% 27.3% 28.1% 28.7%
% Change in Eligible Accepting their Offer on Previous Year 4.1% -5.6% -1.7% -1.3% 16.5% 0.6% -2.4%
Unmet Demand Estimated Eligible Applicants Not Receiving an Offer After Discounting 400 500 1,200 1,100 1,400 1,100 1,000 1,000
% of Eligible Applicants (Unmet Demand) 2.7% 3.3% 7.7% 7.1% 7.1% 4.8% 4.3% 4.4%
% Difference in Estimated Unmet Demand on Previous Year 0.6% 4.4% -0.6% 0.0% -2.3% -0.5% 0.1%
WESTERN AUSTRALIA
Applications ‘On-time’ Applications (Sept) 15,430 15,236 18,556 19,721 18,225 17,064 16,513 15,861
Total Applicants (Feb) 17,862 19,077 21,660 22,659 20,639 19,012 18,389 17,890
Final Applicant Count (March) 17,863
Eligible Applicants (March) 16,293 17,139 18,746 20,232 19,706 18,172 17,658 17,208
% of Total Applicants ‘On-time’ 86.4% 79.9% 85.7% 87.0% 88.3% 89.8% 89.8% 88.7%
% Change in Eligible Applicants on Previous Year 5.2% 9.4% 7.9% -2.6% -7.8% -2.8% -2.5%
Offers ‘Main Round’ Offers (Jan) 13,384 13,338 14,885 15,099 16,039 15,578 15,552 14,731
Total Receiving Offer (Feb) 14,476 15,485 16,316 16,722 17,729 16,888 16,831 15,895
Final Receiving Offer (March) 15,142
Eligible Receiving Offer (March) 14,042 14,703 15,380 16,093 16,534 15,823 15,639 15,142
Unsuccessful Eligible Applicants 2,251 2,436 3,366 4,139 3,172 2,349 2,019 2,066
% Total Offers made during ‘Main Round’ 92.5% 86.1% 91.2% 90.3% 90.5% 92.2% 92.4% 92.7%
% Total Receiving an Offer 81.0% 81.2% 75.3% 73.8% 85.9% 88.8% 91.5% 88.8%
% Eligible Receiving an Offer 86.2% 85.8% 82.0% 79.5% 83.9% 87.1% 88.6% 88.0%
% Change in Eligible Applicants Receiving an Offer on Previous Year 4.7% 4.6% 4.6% 2.7% -4.3% -1.2% -3.2%
Acceptances Final Accepting Offer (March) 10,644
Eligible Accepting Offer (March) 11,078 11,699 11,800 12,505 12,634 11,694 11,180 10,644
% Eligible Accepting Offer 78.9% 79.6% 76.7% 77.7% 76.4% 73.9% 71.5% 70.3%
Rejection Rate (%) 21.1% 20.4% 23.3% 22.3% 23.6% 26.1% 28.5% 29.7%
% Change in Eligible Accepting their Offer on Previous Year 5.6% 0.9% 6.0% 1.0% -7.4% -4.4% -4.8%
Unmet Demand Estimated Eligible Applicants Not Receiving an Offer After Discounting 700 800 2,400 2,900 1,600 900 700 700
% of Eligible Applicants (Unmet Demand) 4.3% 4.7% 12.8% 14.3% 8.1% 5.0% 4.0% 4.1%
% Difference in Estimated Unmet Demand on Previous Year 0.4% 8.1% 1.5% -6.2% -3.1% -1.0% 0.1%
TASMANIA
Applications ‘On-time’ Applications (Sept) 4,111 4,233 4,701 5,054 4,751 4,076 5,249 5,525
Total Applicants (Feb) 6,028 6,042 6,692 6,867 6,183 6,296 7,618 8,510
Final Applicant Count (March) 8,550
Eligible Applicants (March) 5,962 6,464 6,638 6,806 5,734 5,949 7,108 7,640
% of Total Applicants ‘On-time’ 68.2% 70.1% 70.2% 73.6% 76.8% 64.7% 68.9% 64.9%
% Change in Eligible Applicants on Previous Year 8.4% 2.7% 2.5% -15.8% 3.7% 19.5% 7.5%
Offers ‘Main Round’ Offers (Jan) 3,787 4,209 4,805 4,816 4,954 5,357 5,394 5,546
Total Receiving Offer (Feb) 5,110 4,410 5,519 5,767 5,392 6,078 6,317 6,626
Final Receiving Offer (March) 6,330
Eligible Receiving Offer (March) 5,136 5,649 5,667 5,858 5,087 5,354 5,925 5,588
Unsuccessful Eligible Applicants 826 815 971 948 647 595 1,183 2,052
% Total Offers made during ‘Main Round’ 74.1% 95.4% 87.1% 83.5% 91.9% 88.1% 85.4% 83.7%
% Total Receiving an Offer 84.8% 73.0% 82.5% 84.0% 87.2% 96.5% 82.9% 77.9%
% Eligible Receiving an Offer 86.1% 87.4% 85.4% 86.1% 88.7% 90.0% 83.4% 73.1%
% Change in Eligible Applicants Receiving an Offer on Previous Year 10.0% 0.3% 3.4% -13.2% 5.2% 10.7% -5.7%
Acceptances Final Accepting Offer (March) 4,621
Eligible Accepting Offer (March) 2,484 4,235 4,296 4,419 4,107 4,084 4,565 4,087
% Eligible Accepting Offer 48.4% 75.0% 75.8% 75.4% 80.7% 76.3% 77.0% 73.1%
Rejection Rate (%) 51.6% 25.0% 24.2% 24.6% 19.3% 23.7% 23.0% 26.9%
% Change in Eligible Accepting their Offer on Previous Year 70.5% 1.4% 2.9% -7.1% -0.6% 11.8% -10.5%
Unmet Demand Estimated Eligible Applicants Not Receiving an Offer After Discounting 39 42 300 300 200 200 300 700
% of Eligible Applicants (Unmet Demand) 0.7% 0.6% 4.5% 4.4% 3.5% 3.4% 4.2% 9.2%
% Difference in Estimated Unmet Demand on Previous Year -0.1% 3.9% -0.1% -0.9% -0.1% 0.8% 5.0%
TOTAL AUSTRALIA
Applications ‘On-time’ Applications (Sept) 188,024 200,303 211,102 217,077 208,530 203,049 206,099 201,644
Total Applicants (Feb) 220,996 237,511 245,937 247,909 237,590 233,328 240,462 240,974
Final Applicant Count (March) 236,791
Eligible Applicants (March) 209,713 222,728 229,427 228,414 221,588 218,529 218,537 216,134
% of Total Applicants ‘On-time’ 85.1% 84.3% 85.8% 87.6% 87.8% 87.0% 85.7% 83.7%
% Change in Eligible Applicants on Previous Year 6.2% 3.0% -0.4% -3.0% -1.4% 0.0% -1.1%
Offers ‘Main Round’ Offers (Jan) 165,886 161,795 164,106 166,372 179,398 181,735 182,141 180,150
Total Receiving Offer (Feb) 181,118 177,034 179,193 179,708 192,823 193,858 191,871 190,664
Final Receiving Offer (March) 188,521
Eligible Receiving Offer (March) 169,264 168,803 166,309 165,085 178,854 184,869 185,898 183,161
Unsuccessful Eligible Applicants 40,449 53,925 63,118 63,329 42,734 33,660 32,639 32,973
% Total Offers made during ‘Main Round’ 91.6% 91.4% 91.6% 92.6% 93.0% 93.7% 94.9% 94.5%
% Total Receiving an Offer 82.0% 74.5% 72.9% 72.5% 81.2% 83.1% 79.8% 79.1%
% Eligible Receiving an Offer 80.7% 75.8% 72.5% 72.3% 80.7% 84.6% 85.1% 84.7%
% Change in Eligible Applicants Receiving an Offer on Previous Year -0.3% -1.5% -0.7% 8.3% 3.4% 0.6% -1.5%
Acceptances Final Accepting Offer (March) 136,551
Eligible Accepting Offer (March) 125,096 127,373 132,300 130,569 135,412 138,367 141,724 132,552
% Eligible Accepting Offer 73.9% 75.5% 79.6% 79.1% 75.7% 74.8% 76.2% 72.4%
Rejection Rate (%) 26.1% 24.5% 20.4% 20.9% 24.3% 25.2% 23.8% 27.6%
% Change in Eligible Accepting their Offer on Previous Year 1.8% 3.9% -1.3% 3.7% 2.2% 2.4% -6.5%
Unmet Demand Estimated Eligible Applicants Not Receiving an Offer After Discounting 16,200 23,700 35,700 36,100 19,600 14,200 13,200 12,600
% of Eligible Applicants (Unmet Demand) 7.7% 10.6% 15.6% 15.8% 8.8% 6.5% 6.0% 5.8%
% Difference in Estimated Unmet Demand on Previous Year 2.9% 5.0% 0.2% -7.0% -2.3% -0.5% -0.2%

According to Sawhill (2006), American education does not necessarily bring about a balance in existing inequalities that may rise from the difference in socio-economic standing. She argues that at the earlier level of learning this is elementary level, which is very important since it is the foundation of a child’s education, the socioeconomic status of a child’s family largely determines what kind of education that child will get. Though there are government funded public schools right up to high school, the quality of learning within these institutions are lacking. This has a ripple effect, because once a child is left behind at the first stages of learning, catching up later on are minimal. Since admission to Universities is based on merit, students from poor socio-economic backgrounds are at a disadvantage (Sawhill, 2006).

Sawhill points out that a staggering 82% of high school students whose parents are in the high income bracket enroll for college, compared to a much lower 54% of students from low income families. Even in the colleges themselves, 25% of the highest ranked colleges have 74% of their student population coming from high income families (Sawhill).

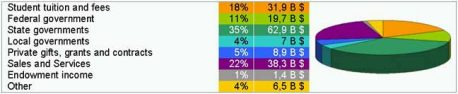
The American government has also taken steps towards minimizing the equity gap and contributes towards the funding of American universities. There are student loans available to those who want to do higher education. According to the federal Department of Foreign Affairs (FBFA, 2009), only eighteen per cent of funding for public degree-granting institutions came from students’ fees in 2000/2001. The bulk of their funds were gotten from their state governments, that being 35%. 22% was from sales and services given by the universities and only 1% from endowment funds.

Table 2: Current-fund revenue of public degree-granting institutions

Current-fund revenue of public degree-granting institutions

Diversity

The United States of America is generally accredited with being a melting pot; it has representation from numerous nations of the world and has great diversity. Within their colleges this diversity is manifested. Other than having students from within the minority groups in the country such as African Americans, Hispanics among others, they have a large number of foreign students as well. In 2007, American universities had slightly over 560,000 foreign students as compared to Australia’s 172, 000 (Pieronline, 2007).

Table 3: International Students–number and percentage annual growth on the previous year

Australia 2006 USA 2005–06 UK 2005–06 Canada 2004–05 New Zealand 2006 Number
% Number % Number % Number % Number % China
46,075 15% 62,582 0% 51,080 -4% 30,516 6% 21,034 -21% India 25,431 15%
76,503 -5% 19,250 15% 7,044 10% 2,136 13% Malaysia 14,932 -3%
5,515 -10% 11,490 0% 873 -8% 1,516 14% Hong Kong 9,948 -7%
7,849 9% 9,575 -12% 2,670 -9% 451 -13% Indonesia 8,772 -8%
7,575 -2% 1,160 1% 861 7% 376 -10% Republic of Korea 5,590 5%
59,022 11% 4,195 5% 4,944 12% 2,141 2% Japan 3,413 -1%
38,712 -8% 6,660 1% 1,812 1% 1,978 -3% Canada 2,879 13%
28,202 0% 5,235 9% 523 2% United States of America 2,579 -1%
21,490 0% 9,462 5% 2,430 -2% Nigeria 106 31%
6,192 -2% 9,615 18% 1,089 23% 31 24% France 849 25%
6,640 1% n/a n/a 7,869 6% 306 13% All countries 172,297 5%
564,766 0% 234,350 2% 140,724 5% 42,652 -10% Other selected source markets Singapore 7,862
-6% 3,909 4% 3,360 -9% 585 -1% 309 -4% Thailand 4,891
-6% 8,765 1% 4,235 7% 399 2% 651 -1% Nepal 1,111
68% 6,061 25% n/a n/a 153 21% 22 -27% Sri Lanka 2,491
16% 2,157 8% 2,775 14% 1,251 2% 127 -15% Mexico 382
-2% 13,931 7% 1,855 -6% 1,893 4% 65 -22% United Kingdom 1,932
1% 8,274 0% 2,079 -3% 697 -8% New Zealand ..
.. 929 3% n/a n/a 153 -6% Australia
2,806 6% 2,010 2% 651 -5% .. .. Top five source market colour key: 1
st 2 nd 3 rd 4 th 5 th n/a: UK numbers only available for top 35 non-EU source markets

Conclusion

Both universities in America and Australia have their strengths and shortcomings. While tuition fees are relatively high in both countries, Australia is much more affordable. However American universities offer a broader spectrum for specialization than Australian universities do.

While both universities offer a certain level of cultural diversity, American universities are more culturally rich as they have a higher percentage of students from all over the world, unlike Australia where majority of foreign students come from Asia.

The funding system in Australian universities is more comprehensive with the HECS in play, and a repayment system that is more comprehensive as compared to student loans in the United States. Both countries however, favor students who come from higher income families and sideline those from poorer social backgrounds.

American universities have been around for a longer than Australian universities and the former country has a greater number of universities that are considered world class. all in all, American universities outdo the Australian ones not only in number, but in a higher rate of admissions, a bigger percentage of government funding and grants, scholarships for students, diversity in both the courses offered and the student population. Australian universities do have their advantages like lower tuition costs but the opportunities at American universities are much greater.

Bibliography

Breen, J (2002). Higher Education in Australia: Structure, Policy and Debate/ Web. 

Commonwealth of Australia (1999), Financing Higher Education in Australia. Web. 

Davis, G (2007). Fairness, Fees and Equity in Higher Education, AFR Higher Education Summit.

Federal Department of Foreign Affairs (2009), Funding of Higher Education in the U.S. Web. 

National Center for Education Statistics (2009), Digest of Education Statistics: Average undergraduate tuition and fees and room and board rates charged for full-time students in degree-granting institutions, by type and control of institution: 1964-65 through 2006-07. Web. 

Sawhill Isabel (2006). Opportunity in America: The Role of Education. Web. 

Seidenstricker Michael (ed.) (2005). College and University Education in the United States, JournalUSA Society and Values, U.S Department of State Vol 10 No. 2.

No author (2007). International Students in Higher Education- Comparison of Main English Speaking Destination Countries, Web.

Universities Australia (2008), Equity and Participation Action Plan. Web. 

Cite this paper

Select style

Reference

StudyCorgi. (2021, November 28). Which Country Has Better Education: Australia or USA? https://studycorgi.com/which-country-has-better-education-australia-or-usa/

Work Cited

"Which Country Has Better Education: Australia or USA?" StudyCorgi, 28 Nov. 2021, studycorgi.com/which-country-has-better-education-australia-or-usa/.

* Hyperlink the URL after pasting it to your document

References

StudyCorgi. (2021) 'Which Country Has Better Education: Australia or USA'. 28 November.

1. StudyCorgi. "Which Country Has Better Education: Australia or USA?" November 28, 2021. https://studycorgi.com/which-country-has-better-education-australia-or-usa/.


Bibliography


StudyCorgi. "Which Country Has Better Education: Australia or USA?" November 28, 2021. https://studycorgi.com/which-country-has-better-education-australia-or-usa/.

References

StudyCorgi. 2021. "Which Country Has Better Education: Australia or USA?" November 28, 2021. https://studycorgi.com/which-country-has-better-education-australia-or-usa/.

This paper, “Which Country Has Better Education: Australia or USA?”, was written and voluntary submitted to our free essay database by a straight-A student. Please ensure you properly reference the paper if you're using it to write your assignment.

Before publication, the StudyCorgi editorial team proofread and checked the paper to make sure it meets the highest standards in terms of grammar, punctuation, style, fact accuracy, copyright issues, and inclusive language. Last updated: .

If you are the author of this paper and no longer wish to have it published on StudyCorgi, request the removal. Please use the “Donate your paper” form to submit an essay.