Introduction
The United States and Canada are the largest economies in North America. According to Pete (2015), there has been a raging debate as to which of the two countries is best to call home. Factors such as income and cost of living are some of the most important factors that can help determine which of the two countries has the best to offer to its residents. The paper focuses on comparing the US and Canadian price levels. The rationale for this research is to compare the quality of life in the two countries. The information will help individuals who are planning to settle in any of the two countries, especially the elderly retirees. Business entities can also find the information important when planning to start a new venture in a foreign land. The econometrics from this research can help them predict the nature of the market. Governments of the two countries can also benefit from the findings of this study when trying to come up with policies meant to improve living standards for citizens. The paper was into five sections. The first section was the introduction part that provided the background of the investigation. The second part was the literature review, which involved investigating what other scholars have found out in this study. The theoretical analysis section reviewed relevant theories for the study. The empirical analysis section was the fourth part of the paper. It provided a detailed analysis of statistics, comparing price levels in the US and that in Canada. The last section provided a summary of the study.
Literature Review
The living standard of a country, according to Coloma and Pon (2017), is defined by the ability of citizens to access and capacity to pay for basic needs and other relevant necessities. When comparing prices of different products in the United States and Canada, the focus is to determine the affordability of these products based on how much residents of the two countries earn per month or per year. According to Kennedy (2017), when one visits a restaurant in the United States, they are more likely to pay more than an individual in Canada. A three-course meal at a mid-range restaurant in the United States would cost about C$ 66.21, while in Canada, the meal at an equivalent facility would be about C$ 65.00 (Numbeo, 2019). The same statistics show that a bottle of 0.33 liter bottle of coke goes for C$ 2.38 in the United States, while in Canada, the same goes for C$ 2.14. The same trend continues for several fast food products in the two countries.
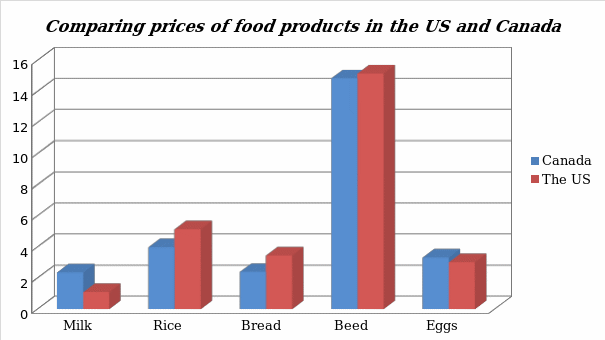
In the market, the comparison of price levels in the two countries varies. A liter of milk in Canada is more expensive in Canada, at C$ 2.34, than in the United States, where it goes at C$ 1.09 (Pete, 2015). A tray of eggs, one kilogram of boneless, skinless chicken breast, lettuce, and Marlboro cigarettes costs more in Canada than in the United States. However, most of the other products are costlier in the United States than they are in Canada. A loaf of fresh 500 grams white bread costs C$ 3.44 in the United States, while in Canada, it costs C$ 2.83 (Numbeo, 2019). A kilogram of white rice goes for C$ 5.12 in the United States, while in Canada, it costs C$ 3.97 (Coloma & Pon, 2017). Other food products such as cheese, red meat, apples, bananas, potato, tomatoes, and onions cost less in Canada than they are in the United States.
The transport sector is another important area that defines cost and standards of living within a given country. According to Coloma and Pon (2017), the United States and Canada have some of the most advanced transport systems in the world. However, the cost of using these services in the two countries varies a lot. Having a monthly pass for regular public transport services costs C$ 92.70 in the United States and C$ 95.00 in Canada (Numbeo, 2019). The price is slightly high in Canada because of the fewer buses offering such services compared to that in the United States. Both the private and public players in this industry enjoy economies of scale. The normal terrify for taxi services starts at C$ 3.75 in Canada, while that in the United States is C$ 4.30. A liter of gasoline goes for C$ 1.24 in Canada and C$ 0.96 (Numbeo, 2019). The statistics show that the price ranges in the transport sector vary in the two countries. In one country, it is more expensive to have certain services than the other is. These factors are defined by various economic and non-economic factors in the two countries.
Utilities, sports, leisure, and childcare are other significant factors that one has to consider when comparing price levels in the two countries. According to a report by Kennedy (2017), the average monthly bill for electricity, cooling, heating, water, and garbage for an 85 square-meter apartment is C$ 147.78 in Canada and C$ 201.84 in the United States. Subscription for a monthly internet with 60 Mbps costs C$ 74.05 in Canada and C$ 83.04 in the United States. A monthly subscription fee for a fitness club in Canada is more expensive (C$48.48) than that of the United States, which has an average price tag of C$ 47.94 (Numbeo, 2019). Parents have to spend more on their children’s education in the United States. Children in Canadian kindergartens pay an average of C$ 958 per month as a school fee, while those in the United States pay C$ 1,173.49 within the same period. The annual school fee for an international primary school in Canada is C$ 14,997, while that in the United States is C$ 22,718.68 (Coloma & Pon, 2017). It is costlier to attend school in the United States than in Canada.
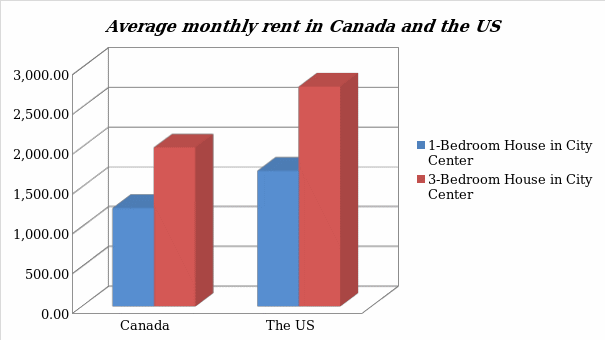
The housing sector in the United States and Canada also shows a significant disparity in terms of cost. Renting a one-bedroom apartment in an urban center in Canada costs an average of C$ 1,245.30 per month, while the same unit in the United States costs an average of C$ 1,705.12 per month (Coloma & Pon, 2017). Although the statistics show that it is cheaper to rent a unit in Canada than it is in the United States, buying the same unit is costlier in Canada. The average price per square meter, when buying an apartment near or within a city center, is C$ 5,969.41, while that in the United States is C$ 3,373.57 (Numbeo, 2019). It makes more economic sense for one to rent than to buy a house in Canada. On the other hand, it is more sensible to buy a house than to rent it in the United States.
After analyzing the average prices of different commodities in the two countries, it is important to compare the income. As Diamandis and Kotler (2014) explain, the price of products in the market may be an inaccurate barometer for measuring living standards in a country if one fails to analyze the level of income. When the cost of the product is high, and the income is equally high, people may not have a problem purchasing various goods and services they need. According to Coloma and Pon (2017), the average monthly salary for an individual in Canada is 3,212.81, while a colleague in the United States earns an average monthly salary of C$ 4,153.99 (Numbeo, 2019). The statistics also show that Canada has a higher rate of taxation than the United States. A company seeking to start a business in any of the two countries should be ready to address the problem of high taxation in each of these countries. The quality of life index in Canada, when healthcare and all the other factors discussed above have been put into consideration, is slightly better than that of the United States.
Theoretical Analysis
The cost of living in the United States and Canada has been on an upward trend over the past decades, primarily because of inflation. However, Kennedy (2017) explains that it is more expensive to live in the United States than in Canada. For a retiree who is keen on spending the benefits in a cost-effective manner, it makes economic sense to stay in Canada than in the United States. On the other hand, for an individual who is keen on starting a business or working for a longer period to increase revenues and savings, the United States would be the ideal country of the two (Kennedy, 2017). In this section, it was necessary to review relevant theories that can help in explaining variations in the cost of various products in each of the two countries.
The theory of demand and supply is one of the most effective concepts that can be used to explain the pricing of products in the market. In this theory, there is the belief that forces in the market, which are demand and supply, often define the price of a product. When the demand for a product is low, but the supply is high, the price will drop significantly. The reduction in the cost of the product will continue to drop until an equilibrium point when the supply for the product meets the demand (Thompson, 2016). Conversely, when the demand for a product is significantly higher than the supply, the price will increase consistently. As the cost rises, the number of people who can afford to purchase the product also decreases. The trend will continue until such a time that a new equilibrium will be reached. The price will stabilize at a level where the demand can be comfortably met by the supply of products.
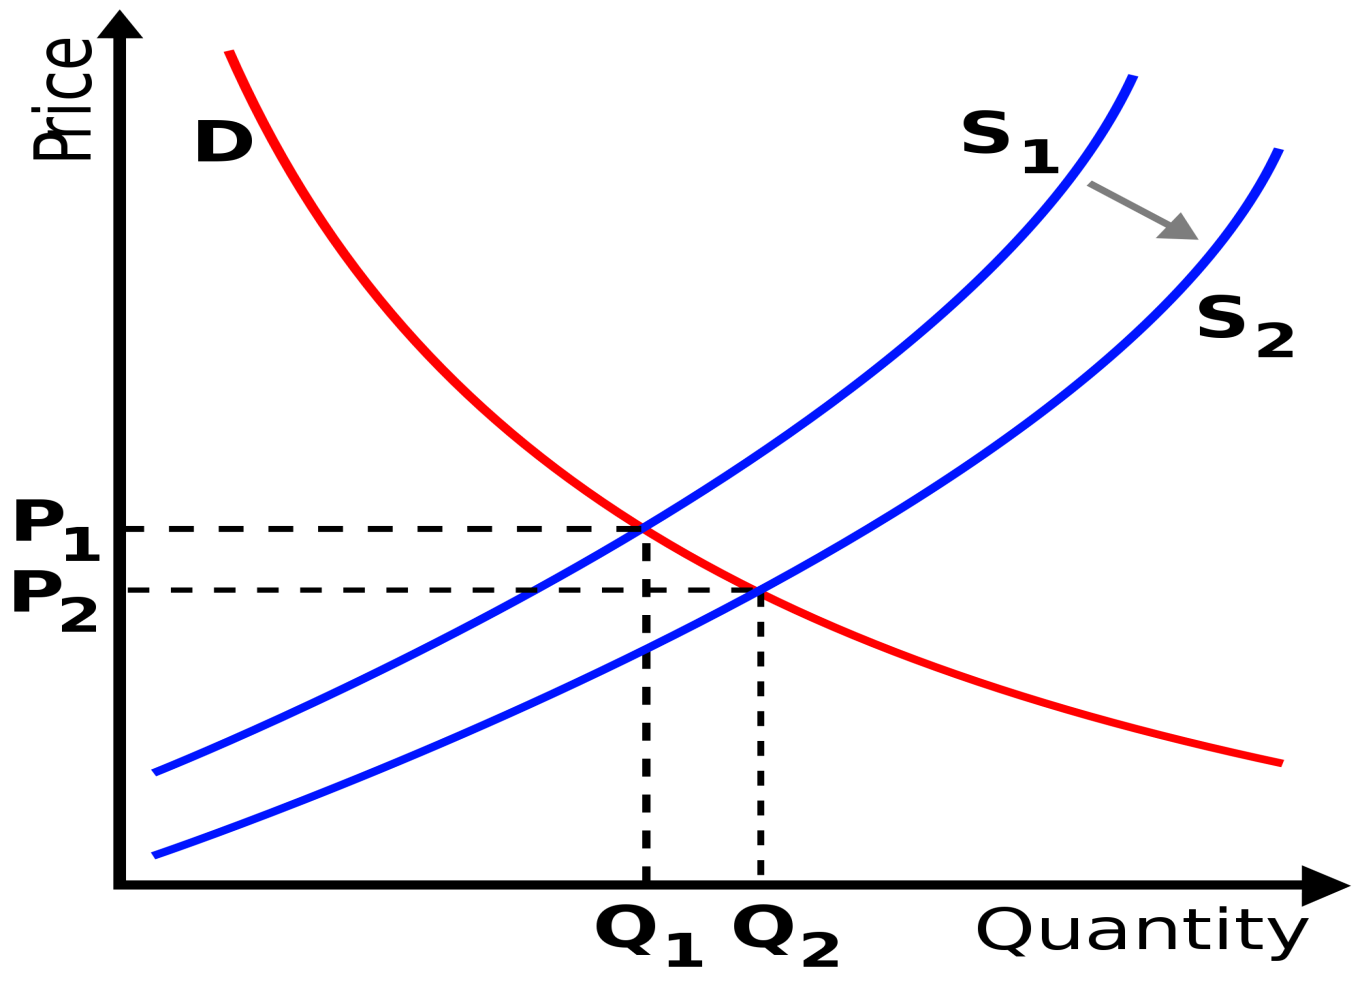
Sometimes there is a shift in supply-demand, as shown in figure 1 below, or a shift in demand as shown in figure 2. A shift in supply may often be caused by non-price factors such as new policies that allow importers to bring their products to the country after the elimination of trade barriers. When the supply shifts to the right, from S1 to S2 (an increase in supply), it creates a scenario where there is a sudden increase in products available in the market. The effect, as shown in figure 1 below, is that the price will drop from P1 to P2. The drop in price is meant to make the product affordable to a higher number of people than before to ensure that more quantities can be purchased from Q1 to Q2. A new equilibrium will be created in the process.

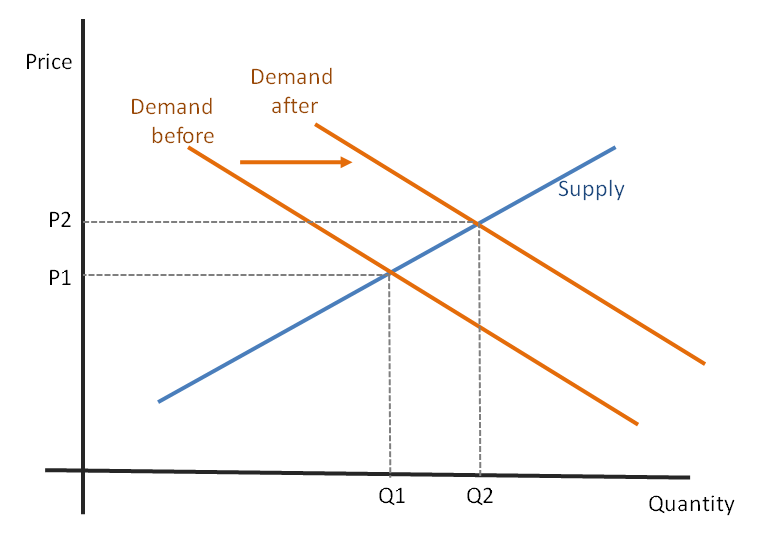
In other cases, it is the demand that would shift instead of the supply. Diamandis and Kotler (2014) explain that a shift in demand to the right, as shown in figure 2 below, may be caused by various factors. One of the factors may be a sudden surge in population. Such cases are common in the United States. This country is still the most attractive nation among immigrants from all over the world. Some of these immigrants come to the country illegally while another group immigrates through various legal means. The majority of them come to the country to engage in business activities, while others come in search of employment (Thompson, 2016). A shift in demand may also be caused by a sudden increase in the number of people consuming a specific product. Such trends may be caused by a government policy or health requirements following new findings in a given research. When the demand increases, the price will increase from P1 to P2. At the same time, the quantity of the product sold in the market will also increase as more people seek to purchase the product.

Empirical Analysis
In this empirical analysis section, the focus was to collect data from various reliable sources that would help in comparing price levels in Canada and the United States. The review of the literature made it possible to collect information from secondary sources about the topic. The theoretical section made it possible to explain the pattern of pricing based on market forces. In this section, the researcher collected recent data to help in making an informed conclusion about price differences in the two countries.
The Data
Data used in this study were collected from various reliable sources. CIA Fact Book was important source information in this study. The website was considered appropriate because it is reliable and updates its data more frequently. A small sample of 20 shoppers was selected to participate in the study. The sample was considered adequate enough for the research. Given the fact that this agency is a government entity primarily concerned with the gathering of intelligence, it has reliable data that was critical for informing the study (Diamandis & Kotler, 2014). The researcher also obtained data from newspapers and other reliable websites with current information needed for the study, such as Numbeo. The following table 1 provided a detailed comparison of prices for restaurant services and market products in the two countries.
Table 1: Prices in Restaurant and Markets in Canada and the US. Source (Numbeo, 2019).
It was equally important to compare the cost of transport, utilities, and childcare in Canada and the United States and Canada. Many families cannot avoid these services. As such, their costs have a direct impact on the overall cost of living within a country. Leisure is also important and rapidly growing in popularity as the size of the middle class in the United States, and Canada continues to increase. Table 2 below shows the price for these services in the two countries.
Table 2. Cost of Transport, utilities, sports, leisure, and childcare in Canada and the US. Source (Numbeo, 2019).
It was also important to review the average cost of rent, clothing and to buy an apartment in the two nations. Clothing is a basic need that one has to purchase frequently. Similarly, rent is another important factor that cannot be ignored when calculating the cost of living within a given city or country. Some people may opt to purchase an apartment instead of renting. The cost of such apartments should also be established and compared. Table 3 identifies the cost of these items and provides the average income for workers in the two countries.
Table 3. Cost of clothing, rent, buying apartment and average salaries in Canada and the US. Source (Numbeo, 2019).
Presentation and Interpretation of Results
The data presented in the tables above clearly demonstrates the disparity in prices of different products in the two neighboring countries. It is apparent that it is more costly for one to live in the United States than in Canada. However, a detailed analysis of the statistics shows that some products are more expensive in Canada than they are in the United States. It means that it depends on what an individual is planning to purchase. One of the first items that one often considers before deciding whether he or she can live in a given city is rent. Figure 3 below shows how the two countries compare.

It is apparent that when one is basing monthly rent as the most important factor, then it is easier to stay in Canada than in the United States. The price of a 3-bedroom unit in the United States is significantly higher than that of Canada. Data in table 3 shows that when one is planning to purchase a house, then the United States is a better option because it is cheaper than the price in Canada. Food is another important factor that defines the cost of living in a country. Figure 4 below shows a comparison of some of the most important food items in the two countries.

The statistics above show that food products are relatively more expensive than in Canada. The cost of rice, bread, and beef is higher in the United States than in Canada. Purchasing fruits also costs more in the United States than in Canada. However, milk and eggs cost less in the United States compared with what is the case in Canada. Factors such as the cost of production and government policies through taxation and other factors have a direct impact on the cost of each product. On average, it is less costly to live in Canada than it is in the United States. When one is planning to make a decision on which of the two countries to live in, it would be advisable to go beyond the prices of various products. Diamandis and Kotler (2014) explain that although the cost of living is one of the most important factors that one has to consider, it is advisable not to ignore factors such as the level of income and personal interests. Data collected shows that a worker in Canada is likely to earn less than a colleague in the United States.
Conclusion
The United States and Canada are the largest economies in North America. In this paper, the researcher was interested in comparing prices of commodities in the two countries to determine which offers the best standards of living for its residents. The comparison shows that the average prices for most products are significantly less in Canada than they are in the United States. Facts gathered from primary data were in line with the information obtained from the review of the literature. The strength of data used in this study is that it was obtained from different sources. However, its main weakness was that the researcher did not find time to interview consumers from both countries. Factors such as demand, which is often determined by the population of a country and purchasing power, availability of products, and government policies, define the price of different commodities. On average, it is cheaper to live in Canada than in the United States. The decision to live in either of the two countries would be determined by personal interest, as discussed in the paper. Future research should focus on comparing the role of the two governments in determining price levels.
References
Coloma, R. S., & Pon, G. (2017). Asian Canadian studies reader. Toronto, Canada: University of Toronto Press.
Diamandis, P. H., & Kotler, S. (2014). Abundance: The future is better than you think. New York, NY: Free Press.
Kennedy, P. E. (2017). Macroeconomic essentials: Understanding economics in the news. Cambridge, MA: MIT Press.
Numbeo. (2019). Cost of living comparison between Canada and United States reverse. Web.
Pete, C. (2015). Inflation matters: Inflation wave theory, its impact on inflation past and present, and the deflation yet to come. London: UK: Pete Comley.
Thompson, W. (2016). Canada 2016-2017. Lanham, NY: Rowman & Littlefield Publishers.