Introduction
The central design of pilot stage 2 was based on the development of a product that would meet the criteria identified in the market research. Recall that the results of this study concluded that for the target audience, represented by young people aged 20-34 with problematic skin, the most relevant product would be a product that is a lightweight, water-based moisturizing cream with a gel formula. According to the survey, such an acne cream should also be non-comedogenic, moisturizing for sixteen hours and create a glowing effect.
Acne should be understood to be an inflammatory process that affects the hair follicle, preventing natural hair growth and skin health. Visually, this is manifested by the appearance of inflammatory rashes and comedones on the skin. Healthy skin can produce sebum that comes to the surface through the pores; however, when inflammation occurs, the follicle pores become clogged so that sebum production is functionally impaired (NIH, 2020). This results in localized inflammation, which creates therapeutic and aesthetic discomfort. Because a cream is water-based, in order to reduce the evaporation of water molecules, it is necessary to use substances that can attract them and retain moisture longer – propylene glycol has been chosen as such a substance based on the rheological tests of various formulations. Substances that normalize the acidity of the solution should be used, thus creating an optimum pH, which prevents irritation or burns. Water-based creams have an increased fluidity, which may cause discomfort and not produce the desired effects. For this reason, it is necessary to use a thickening agent, which creates the necessary viscosity of the product, helps to retain the material on the face longer and gives a creamy texture.
After thorough rheological testing and stability testing, a final cream formula was proposed in order to determine a robust formulation that meets the marketing needs of the target audience. In addition, the cream was investigated in a focus group to obtain initial results on its efficacy and consumer satisfaction with the proposed formulation. This report details the research carried out with regard to the formulation developed and the evaluation of the effectiveness of the chosen formulation
Goals and Objectives
This report was motivated by developing an in vivo product that met the specifications and demands of the target audience identified during the market research. It was necessary to develop and select the best and safest formulation, for which rheological and consumer expertise was subsequently conducted to determine compliance with the claimed characteristics and expected efficacy. The multidisciplinary goal of the report was fragmented into tasks that simplify the sequence of actions, which include:
- Development of a stable formulation that meets specifications;
- Rheological studies of the created prototype to examine physicochemical properties;
- Postulating a final formulation that has the desired characteristics;
- Conducting focus group testing to verify the perceived effectiveness of the product.
Materials
The materials used to develop the cream formula are listed in Table 1.
Table 1: List of used materials with corresponding characteristics
Methods
Formulations
The fabrication of the desired product formulation was based on a consistent approach to finding the optimal formulation that met the specifications. Two formulations were chosen as optimal, with differences in the emollients used. Table 2 shows the component composition of both creams, indicating the difference between them, as well as information on the quantitative measure (mass fraction) of each component.
Table 2: Two used cream formulations with marked differences in emollients
pH
The pH Meter 4330, manufactured by Jenway, UK, was used for the acidity analysis — several tests were performed to increase the reliability of the results, and then the values were averaged.
Stability Assessment
Product stability under normal conditions was evaluated for four weeks, during which time the 50 g prototypes were placed in a glass jar with polypropylene lids under two conditions. First, the prototypes were placed in room temperature conditions in daylight. Second, the prototypes were placed in an OP60 Oven, manufactured by LTE Scientific, LTD, UK, at 45°C.
Stress Testing
Assessment of the stress resistance of the products was used to examine their stability. For this purpose, 10 g of each prototype were placed in a cylindrical tube, then loaded into a centrifuge at 3000 rpm for 30 minutes. The centrifuge was a Heraeus Labofuge 400 Centrifuge, manufactured by Thermo Fisher Scientific, UK.
Viscosity Assessment
The viscosity of the preparations as a parameter of material resistance was measured on a D-VE Viscometer, manufactured by Brookfield, USA, at 3 rpm using a fourth spindle. To increase the reliability of the results, five measurements were taken for each sample, after which the results were averaged.
Rheological Testing
A Hakke MARS iQ Air, manufactured by Thermo Fisher Scientific, UK, was used to evaluate the rheological characteristics of the prototypes. Operating settings included a current of 1-2000 pA at a frequency of 1 Hz, and the size of the toothed plate to create the gap was 0.01 mm. The studies were performed at 20°C. The RheoWin Data Manager software was used to record the results and to interpret them further.
Texture Analysis
Texture analysis of the created prototypes was performed using the TA XT Plus Texture Analyser, manufactured by Stable Micro Systems, UK. Sample texture was determined by piercing using the Fromage Frais Penetration method, and Exponent primary results software was used for analysis.
Consumer Test
The in vivo prototype cream study was conducted at home for 14 days, from May 9 to 23, 2022. Twenty-one volunteers participated in the study, who were familiar with the goals and objectives of the project, as well as aware of the possible risks. Because two prototypes were to be studied, a unique skin area was chosen for each, namely the left and right forearms of the focus group participants. Data on perceived efficacy and drug characteristics were collected using Google Forms and then subjected to statistical processing through the use of SPSS v.25. For valid and reliable sample testing, participants were given instructions to complete. Table 3 highlights the main steps of the self-testing protocol sent out to volunteers and shows how much time is tentatively required for each step.
Table 3: Protocol of activities to be performed as part of sample testing
Results
pH
After averaging the results of several measurements, it was found that the final acidity for formula J was 6.2, and 5.2 for Y.2.
Stability Assessment
The emulsions of the two prototypes, aged four weeks, showed high stability and stability over time. No splitting, changes in colour or consistency, or formation of lumps were noticeable for the two developments, from which it can be concluded that the creams are highly stable.
Stress Testing
From the centrifugation results of both samples, it was found that formula Y.2 showed slight stratification in the O/W emulsion at the upper levels of the centrifuge, which was not found for J.
Viscosity Assessment
Viscosities were measured for each prototype using the fourth spindle — Table 4 shows the value of each measurement and the average viscosity value. It is noticeable that the viscosity of prototype J was about 2.15 times higher than that of prototype Y.2 with a torque difference of 7.4%.
Table 4: Viscosity measurement results of each formula with averaging
Texture Analysis
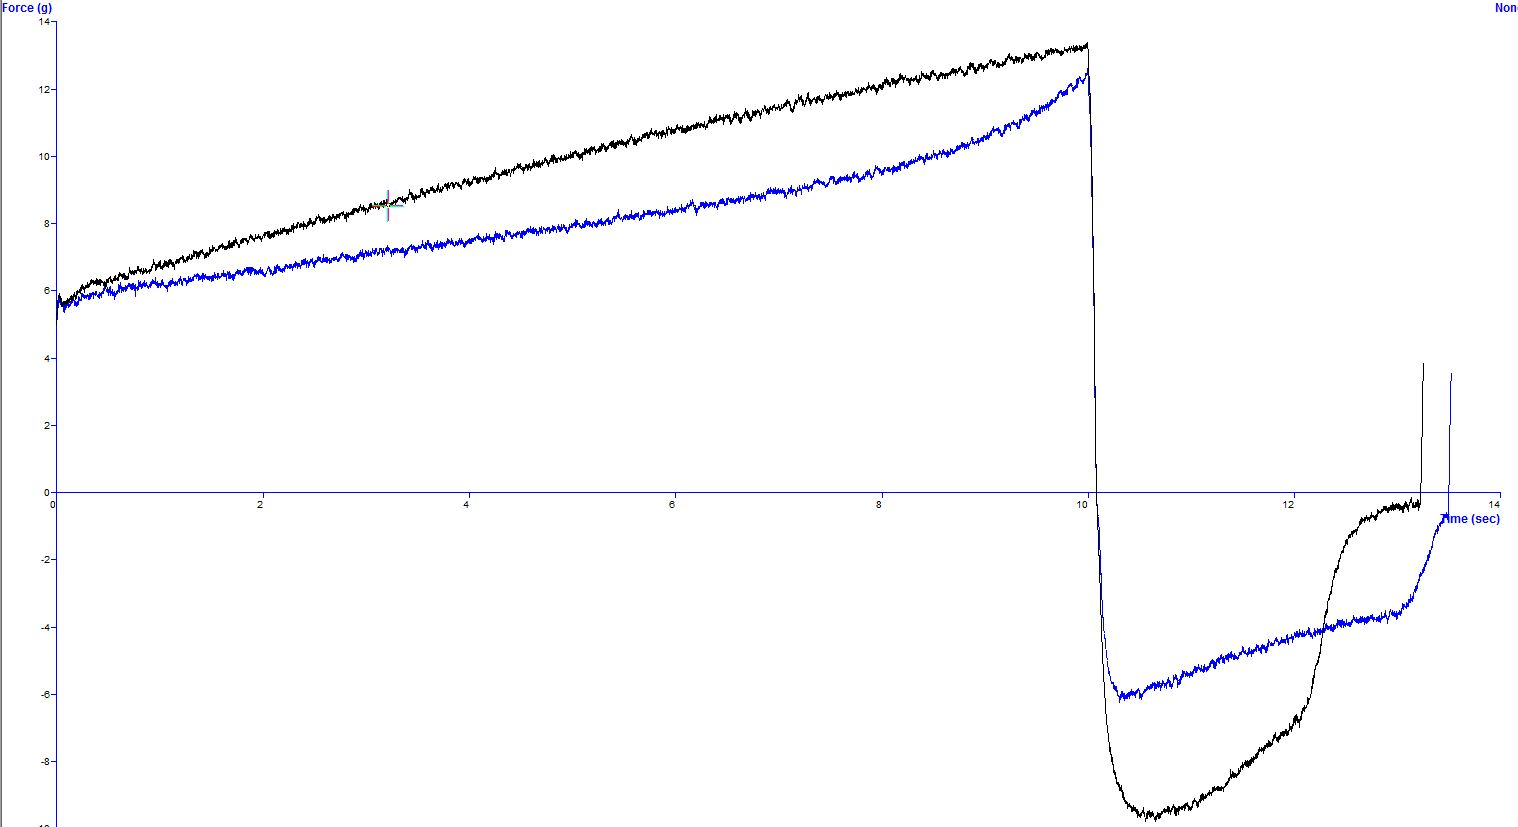
Comparing the two prototypes for material hardness and distributability determined that sample J was harder and less distributable because it exhibited a larger area under the texture analysis curve in Figure 1. In addition, prototype J was found to have significantly greater adhesion, as the area in the negative region was 1.27 times higher than for formulation Y.2.
Table 5: Texture analysis results for the two prototypes
Rheological Testing
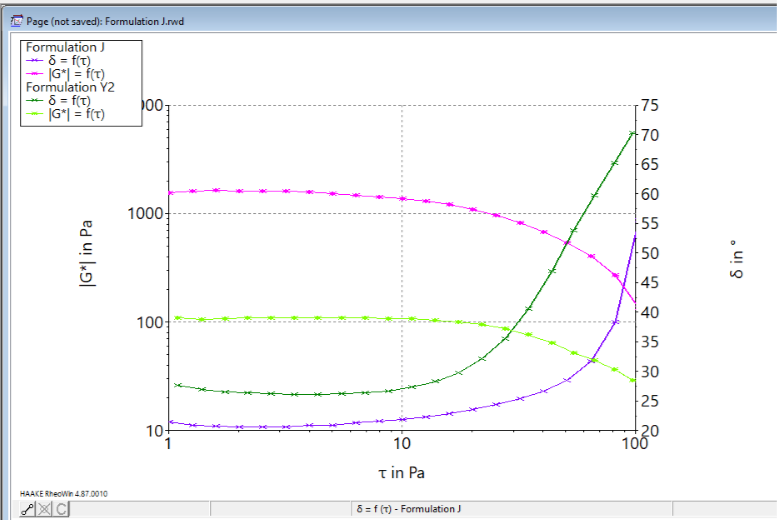
The Oscillatory stress sweep in Figure 2 demonstrates that sample J had increased stiffness compared to sample Y.2, which also confirms the results of the previous textural analysis. The elasticity of the sample was also determined to be different: prototype J had increased elasticity as δ on the graph had the lowest values, and vice versa.
Consumer Testing
A focus group of 21 respondents was created to conduct consumer testing of the two prototypes developed, with a higher number of women in the sample (81%, n = 17) than men (19%, n = 4). The largest number of participants (76.2%, n = 16) belonged to the 18 to 24 age group, with the remainder (23.8%, n = 5) in the 25 to 30 groups. Notably, 42.9% (n = 9) of respondents rated their skin as prone to acne, while 57.1% (n = 12) stated the opposite.
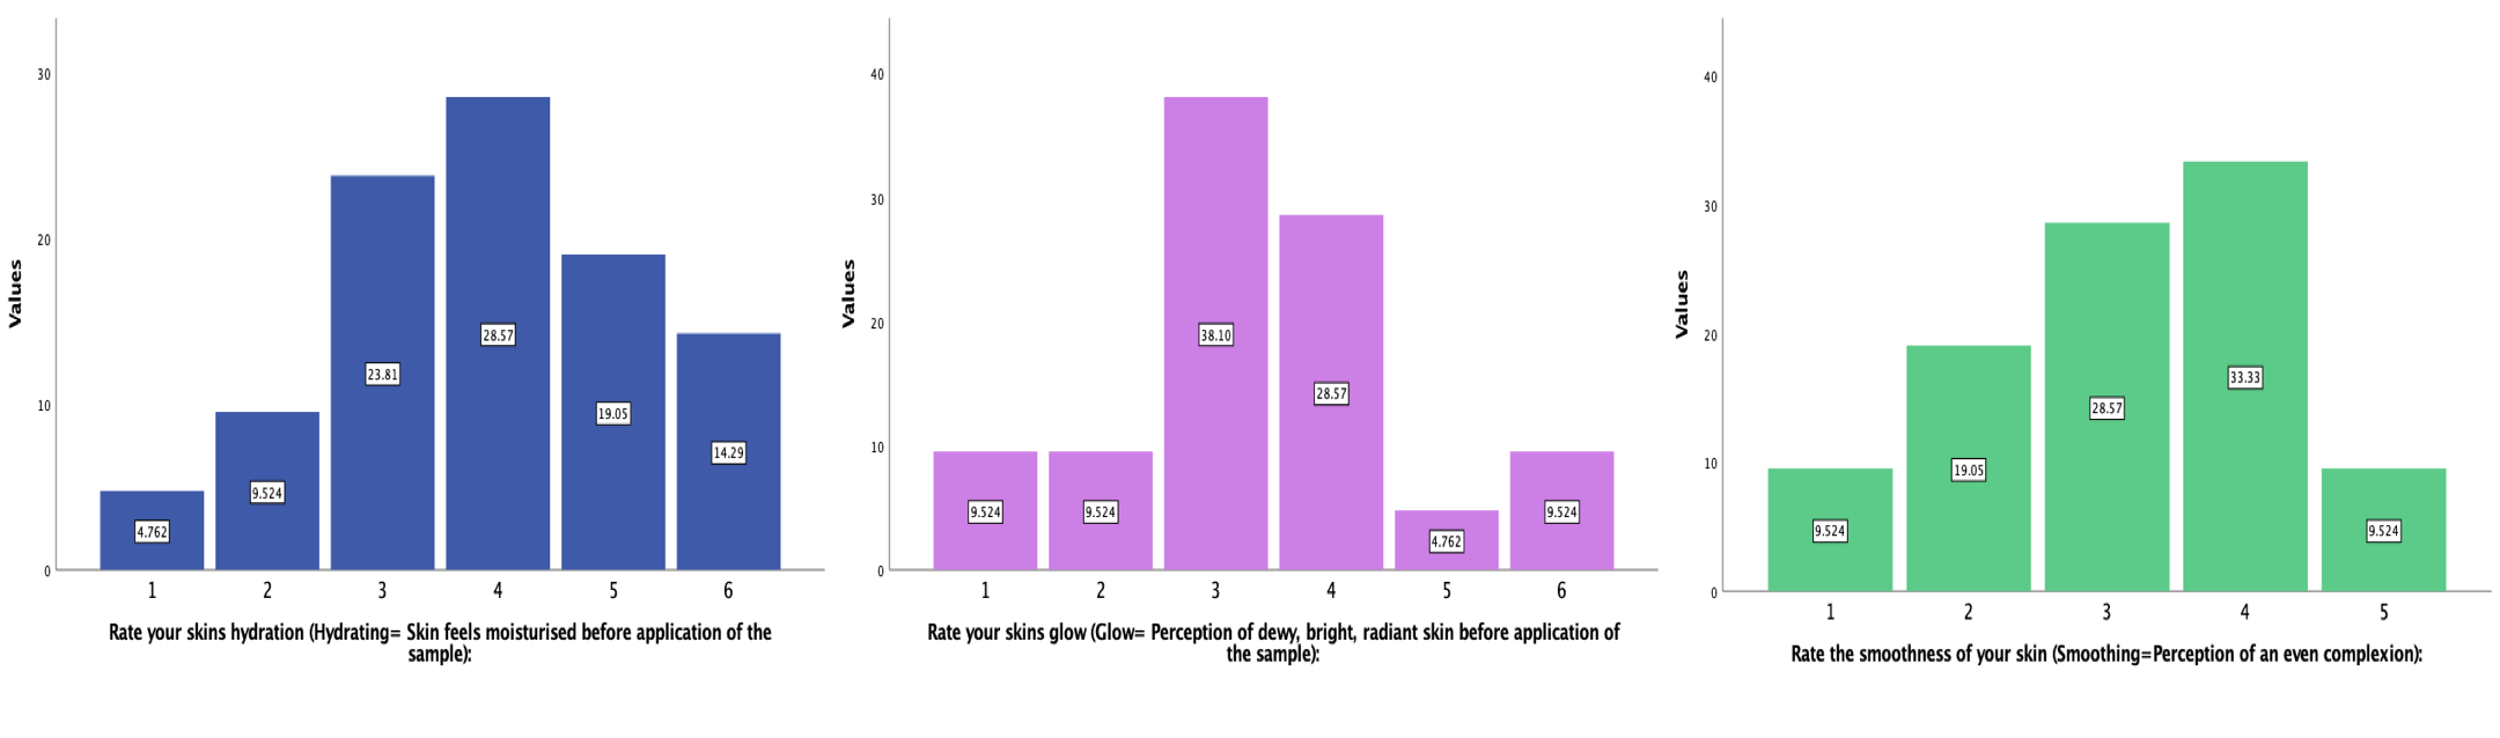
Table 6: Consumer test results of two prototypes, J and Y.2, after first application
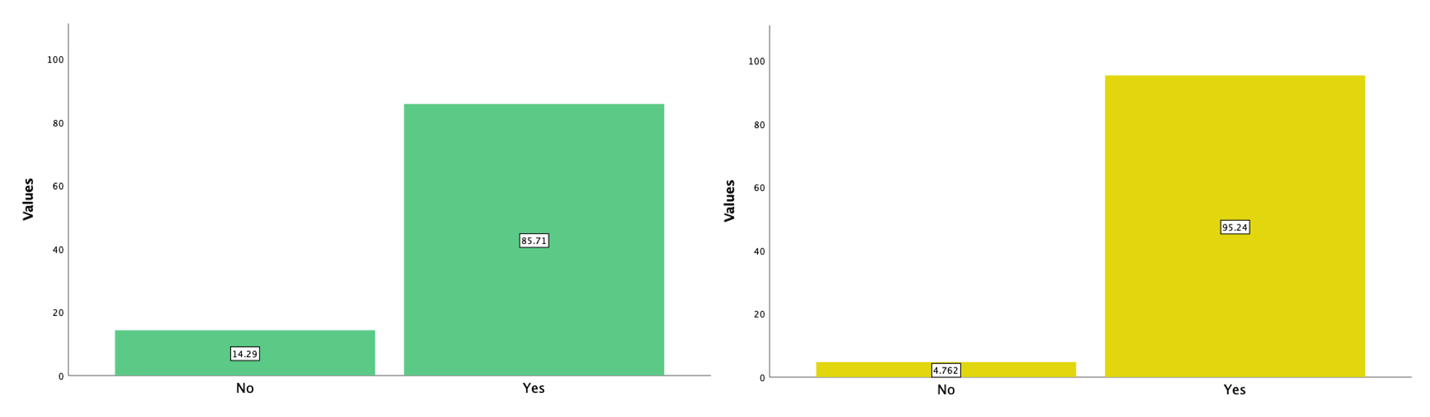
Table 7, Desire to recommend the product to their friends
For the nonparametric test (n < 30), the assumption of normality of the data distribution was tested beforehand. The results of the Shapiro-Wilk test showed that the distributions were mostly nonnormal, which supports the choice of the nonparametric test. For the Y.2 prototype, the Wilcoxon signed-rank test showed a statistically significant difference in weekly cream use for skin glow only, Z = -3.065, p =.002, supported by the increased median. Notably, the same results were found for prototype J: Z = -2.171, p =.030. The Friedman test (Laerd Statistics, 2020) was used to compare the statistical significance of the differences between the Y.2 and J creams after one week of application. Table 8 reports that the differences in a mean between the two prototypes were statistically significant for hydration, glow, smoothing, and overall cream satisfaction levels.
Table 8: Results of the Friedman test to test for differences between J and Y.2
Discussion
This study evaluated the properties of two prototype creams developed according to a market research specification. The product specification stated that the gel cream should have the ability to provide long-lasting hydration, the presence of vitamins in the composition, glowing skin, light consistency and the ability to fight acne. Polysorbate 80, a perfectly safe dehydrated form of sorbitol, was used in cream Y.2 to create a suitable consistency (Danila et al., 2021). In cream J, sucrose stearate was used instead of polysorbate 80. To ensure that the cream was not too liquid, Acrylates/C10-30, acrylic and methacrylic acid polymer with acrylate C10-30, also proven safe for use on the skin, was used as a thickener (Dobler et al., 2019). In addition, the creams contained Propylene Glycol, an organic compound that is safe for the health of consumers in the absence of allergic reactions, which has no odour or colour and therefore does not affect the organoleptic properties of the cream; at the same time, Propylene Glycol has excellent water retention and increases the duration of the moisturising effect (Shunatona and Engelman, 2021). For a skin cream, it is essential that it does not cause irritations and allergic reactions, which are mainly caused by a sub-optimal pH value. Since the pH for healthy skin ranges from 4.1 to 5.8, it is evident that the ingredient used must have an acidic environment to lower the final pH of the cream (Proksch, 2018; Tavella, 2019). The use of Carboxylic acid salt instead of Sucrose Stearate lowered the pH of cream Y.2, which, however, did not prevent the absence of skin irritation among the focus group.
Rheological results showed that both creams were highly stable, but the Y.2 sample was less stiff and had a lower pH than the J sample. However, according to consumer testing, no difference in irritation was found between J and Y.2. In addition, the increased stiffness of J confirms the increased adhesion of the material to the skin, which may hinder consumers’ desire for a lighter cream (Alexandria, 2021). On the other hand, increased adhesiveness allows the cream material to penetrate the skin better and realize the therapeutic effect (Ekubaru et al., 2020). It has also been shown that J spreads worse over the skin than Y.2, from which it can be concluded that J will have worse organoleptic properties and final effects than Y.2, but this assumption needs to be verified. The viscosity of Y.2 was higher than for J: Low-viscosity, water-based creams have an increased fluidity, which may cause discomfort and not produce the desired effect.
The moisturising effect as the most important specification criterion was achieved through a mixture of propylene glycol and glycerine. It is known that these moisturizers can be associated with allergic reactions, and the occurrence of a single case of skin irritation in a focus group after a week of use may be justified by this (Lalla et al., 2018). Meanwhile, consumer testing results showed a significant difference in moisturizing effect between J and Y.2, the focus group more favourably accepted Y.2. Hence, the development meets the specifications but does not rule out the possibility of allergic reactions.
The instrumental method of testing the cream for allergenicity is implemented through an alternative patch test on non-biological tissues. In particular, Bioskin can be used as an artificial skin, which has already demonstrated the possibility of an error-free alternative for testing on human skin (Eudier et al., 2019). After the creams were applied to the artificial skin, biological properties were analysed instrumentally, including spectral methods, followed by statistical tests (ANOVA, Friedman’s test) to determine statistically significant results.
In addition, luminescence was taken into account as a significant factor. The creams did not give an artificial glow but instead fought dryness and moisturized the skin, which created this effect. In particular, the glow was achieved by combining moisturising ingredients with texturising Acrylates/C10-30 and the protective agent Dimethicone (Draelos, 2018). It is worth noting that niacinamide has been used as a preservative for long-lasting creams, but an additional property of this substance is to give the skin an elastic and healthy appearance (Carter, 2018). In addition, niacinamide is a form of vitamin B3, which makes it of interest to the consumer.
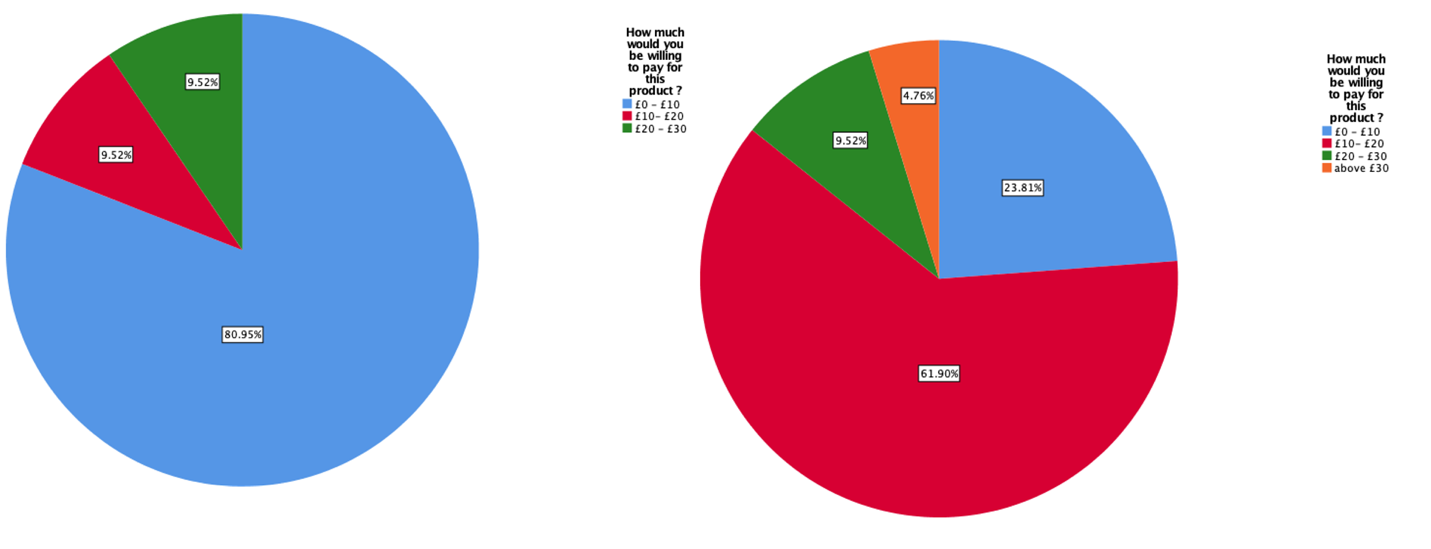
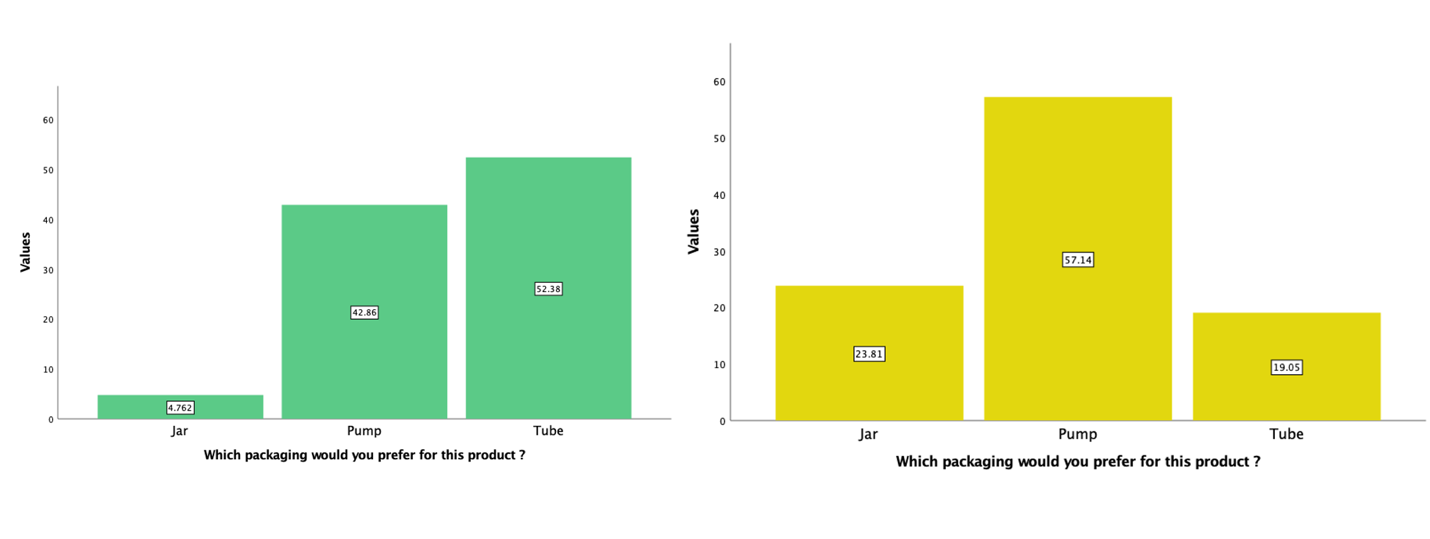
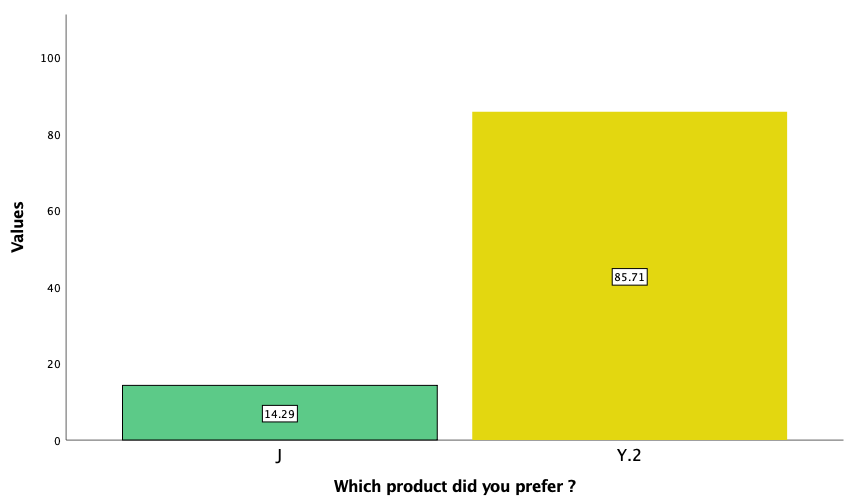
Studies of the repeated effects of the two creams showed a slight decrease in the average moisturising score for Y.2 and an increase for J. According to the focus group survey, this is an intriguing result as almost 86% of people were inclined to choose Y.2 blindly. In terms of marketing development, the pump was identified as the preferred packaging option for Y.2, which is in line with the evidence of the lower viscosity of Y.2 compared to J, for which the tube was more frequently chosen. Finally, the Y.2 cream received higher value ratings, indicating that consumers perceive this development as more useful and of higher quality.
Conclusion
To summarize, the paper obtained two creams according to specifications, with laboratory and consumer testing indicating that the Y.2 development appears to be more favourable. The focus group evaluated the high moisturizing, brightening, and smoothing properties of the cream. In addition to the product’s safe formulation, Y.2 can claim excellent consumer results. However, during analysis, a single case of skin irritation was found, which could have been due to an individual allergic reaction or outside factors. In any case, this creates a need for further investigation of the allergenic properties of the cream and probably a refinement of the product, if necessary.
Table 9: Final product specification
Table 10: Final product claims and substantiation
Executive Summary
It can be reported on the successful development of cream for the care of problematic skin, whose target audience is young people. The marketing analysis showed that the audience would like to see long-lasting hydration, glowing, a cooling effect, matting, lightness, and quick absorption in the cream. In addition, they would like to see hyaluronic acid, vitamins and niacinamide in the composition. The laboratory report showed that the developed prototypes generally meet these requirements well and offer moisturizing, matting and brightening effects.
Meanwhile, the developed prototypes lacked cooling effects and no measurement of how long the skin’s moisturising properties were found to last, which creates an opportunity for further research. In addition, it is helpful for future studies to expand the sample and carefully assess the allergenic properties of the prototypes. Microbiological and legal compliance analyses should be carried out for market entry to investigate the possibilities of commercial expansion of the project.
Reference List
Alexandria (2021) Why do my skincare products leave my skin feeling sticky? Web.
Ekubaru, Y., et al. (2020) ‘Fabrication and characterization of ultra‐lightweight, compact, and flexible thermoelectric device based on highly refined chip mounting’, Advanced Materials Technologies, 5(5), pp. 6105-6116.
Carter, A. (2018) Everything you should know about niacinamide. Web.
Danila, A., et al. (2021) ‘Eco-friendly O/W emulsions with potential application in skincare products’, Colloids and Surfaces A: Physicochemical and Engineering Aspects, 612, pp. 1-15.
Dobler, D., et al. (2019) ‘Impact of selected cosmetic ingredients on common microorganisms of healthy human skin. Cosmetics, 6(3), pp. 45-58.
Draelos, Z.D. (2018) ‘The science behind skin care: moisturizers’, Journal of Cosmetic Dermatology, 17(2), pp. 138-144.
Eudier, F., et al. (2019) ‘Prediction of residual film perception of cosmetic products using an instrumental method and non-biological surfaces: the example of stickiness after skin application’, Colloids and Surfaces B: Biointerfaces, 174, pp.181-188.
Laerd Statistics (2020) Friedman test in SPSS statistics. Web.
Lalla, S.C., et al. (2018) ‘Patch testing to propylene glycol: the Mayo Clinic experience’, Dermatitis, 29(4), pp. 200-205.
Proksch, E. (2018) ‘pH in nature, humans and skin’, The Journal of Dermatology, 45(9), pp. 1044-1052.
Shunatona, B., and Engelman, D. (2021) What’s the truth about propylene glycol in skincare? Web.
Tavella, V. J. (2019) About skin pH and why it matters. Web.
NIH (2020) Overview of acne. Web.