Anaerobic Threshold: An Experiment

Anaerobic Threshold refers to the minimum level below which no increase in blood lactose can occur. Levels below AT energy necessary for performing an exercise is generated from aerobic reserves. However, at levels above AT, supplementing aerobic production necessitates aerobic energy. Svedahl and MacIntosh (2003, p. 299) define AT as the level of exercise during a rigorous muscle movement whereby all the energy required cannot be accounted for by measurement of oxygen uptake.

AT intensity is a significant variable in endurance sports. In determining performance, it plays the fundamental role in monitoring the training schedule. If athletes are to engage in endurance events they need to develop ability to sustain a highly fractional usage of their maximal oxygen uptake (%VO2 max) causing the athlete to be physiologically efficient in the activities they perform (Ghosh 2004, p. 24)

During increment in exercise, at a certain intensity, there is a nonlinear steep increase in ventilation, known as Ventilation Anaerobic Threshold. Similarly, lactate threshold which is a nonlinear increment in blood lactate concentration, is followed by a non linear increment in CO2 production, an arterial lactate level of 4mM/L known as the onset of blood level lactate accumulation (OBLA), and an increase in FEO2. These points are all labeled as AT (Ghosh, 2004, p. 26; Hollman, 1959). The AT can be assessed in several ways. These include using the lactase threshold or the ventilation threshold (McArdle, Katch, F and Katch, V., 2001).

Ventilation threshold (VT)

VT results when increase in ventilation does not equate increasing power output or locomotion at a given exercise intensity. (Svedahl and MacIntoch, 2003, p. 310). Among the various methods of determining VT, the level at which VE/VO2 ratio begins to increase, is also used. McArdle, et al. (2001) utilized computerized regression analysis of the VCO2 verses VO2 slope.

Lactases threshold (LT)

On the other hand, LT involves the relatively high increase in blood lactate due to an incremental exercise test at a given exercise intensity (Svedahl and MacIntoch, 2003, p. 323). It can be determined through different methods including Blood lactase, where the test measures the lactase response to as given workloads. As the intensity of the exercise increases for the athlete, blood samples from the ear lobes or fingertip are collected. The point where the lactate begins to rise very fast is the point said to be the LT. Physiologists term LT as the point where there is a rise of more than 1mmol of lactate from the resting level. The lactase level rises linearly with the workloads until it reaches AT it breaks the linearity (Chad, 2009). It can also be measured through a field test. Here the athletes complete as 120-120 minute-trial effort as hard as they can. The average power and heart rate recorded and the percentages of these values are used to determine the LT (Hollman, 1959).

Below are tables for the results of the protocols (1-4) and their calculation of VE, VO2 and VCO2.

Table 1: protocol one (p1)

Protocol time(min) power(W) FEO2
(%)
FECO2
(%)
VOL 30sec
(L)
Blood lactate
(MMOL.L-1)
VE VO2
(absolute)
VCO2 VE/VO2 VE/CO2
p1 0 to 1 90 16.9 3.68 37.33 1.7 67.19 1121.51 247.27 0.060 0.272
p1 1 to 2 120 16.8 3.57 33.91 2 61.04 1012.66 217.91 0.060 0.280
p1 2 to 3 150 16.3 4.03 35.93 2.3 64.67 1040.65 260.64 0.062 0.248
p1 3 to 4 180 16.6 3.92 41.67 2.9 75.01 1229.40 294.02 0.061 0.255
p1 4 to 5 210 16.8 3.81 52.09 3 93.76 1555.58 357.23 0.060 0.262
p1 5 to 6 240 16.9 3.78 57.7 5.1 103.86 1733.50 392.59 0.060 0.265

Table 2: Protocol two (p2)

protocal Time
(min)
Power
(W)
FEO2
(%)
FECO2
(%)
VOL 30sec(L) Blood lactate
(MMOL.L-1)
VE VO2
(absolute)
VCO2 VE/VO2 VE/CO2
p2 0 to 3 90 16.5 3.87 33.1 1.2 59.58 970.60 230.57 0.061 0.258
p2 3 to 6 120 16.4 3.9 32.15 1.9 57.87 936.96 225.69 0.062 0.256
p2 6 to 9 150 16.6 3.85 41.1 4.3 73.98 1212.58 284.82 0.061 0.260
p2 9 to 12 180 16.8 3.8 54.74 5.1 98.53 1634.71 374.42 0.060 0.263
p2 12 to 15 210 17.7 3.58 68.04 5.1 122.47 2142.12 438.45 0.057 0.279
p2 15 to 18 240

Table 3: Protocol three (p3)

protocal power(W) FEO2(%) FECO2(%) VOL 30sec(L) Blood lactate(MMOL.L-1) VE VO2(absolute) VCO2 VE/VO2 VE/CO2
p3 60 15 4.76 16.43 3.1 29.57 437.42 140.77 0.068 0.210
p3 120 15.4 4.82 28.21 3.4 50.78 771.35 244.75 0.066 0.207
p3 180 16.2 5.09 30.39 7.1 54.70 874.72 278.43 0.063 0.196
p3 240 16.5 4.9 60.28 7.9 108.50 1767.61 531.67 0.061 0.204

Table 4: Protocol four (p4)

protocal Power
(W)
FEO2(%) FECO2
(%)
VOL 30sec(L) Blood lactate
(MMOL.L-1)
VE VO2
(absolute)
VCO2 VE/VO2 VE/CO2
p4 60 16.14 5.05 14.5 1.5 26.1 415.79 131.81 0.063 0.198
p4 80 16.77 3.71 17.17 2.1 30.91 511.82 114.66 0.060 0.270
p4 100 15.23 4.84 21.67 5.3 39.01 585.90 188.79 0.067 0.207
p4 120 16.11 4.19 27.17 6.4 48.91 777.64 204.92 0.063 0.239
p4 140 15.84 4.49 28.78 6 51.80 809.73 232.6 0.064 0.223
p4 160 15.52 4.85 37.51 5.4 67.52 1033.75 327.46 0.065 0.206
p4 180 16.48 4.38 53.69 7.4 96.64 1572.43 423.29 0.061 0.228
p4 200 16.77 4.11 61.72 9.2 111.10 1839.83 456.60 0.060 0.243
p4 220

The figures below were used to compare and determine the Ventilation and Lactate threshold. In all cases the LT/VT are indicated when there is a spike in the graph.

The figure alongside was used to determine the ventilation threshold (VT) for subject 1 for protocol 1. The VT for the subject occurred at about 6 minutes and at VO2 of 1050 ml/kg/BM/min
Determine the Lactate threshold (LT)

The figure alongside was used to determine the Lactate threshold (LT) for subject 1 for protocol 1. The LT for the subject occurred at 9 minutes and at blood lactate level of 3.0mml.L-1.

The figure alongside was used to determine the ventilation threshold (VT) for subject 2 for protocol 2. The VT for the subject occurred at about 8 minutes and at VO2 of 1000 ml/kg/BM/min
The figure alongside was used to determine the Lactate threshold (LT) for subject 1 for protocol 1. The LT for the subject occurred at 8 minutes and at blood lactate level of 2.0mml.L-1.
The figure alongside was used to determine the ventilation threshold (VT) for subject 2 for protocol 3. The VT for the subject occurred work load of 177 watts and at VE of 55
The figure alongside was used to determine the Lactate threshold (LT) for subject for protocol. The LT for the subject occurred at work load of 124 watts at blood lactate level of 3.4 mmol.L-1.
The figure alongside was used to determine the ventilation threshold (VT) for subject 2 for protocol 4. The VT for the subject occurred work load of 120 watts and at VE of 49.
The figure alongside was used to determine the Lactate threshold (LT) for subject for protocol. The LT for the subject occurred at work load of 160 watts at blood lactate level of 5.1 mmol.L-1.
The figures below compare the different protocols for the two subjects
The figure above compares the blood lactase levels for protocol 1(p1) and protocol 2(p2). The blood lactase levels when the subject is measured after every 1 minute (P1) is less steep than when the levels are measured after every 3 minutes (P2). The subject when using the second protocol is seen to gets to the LT earlier than when using P2. Despite the protocol used, the subject reaches the Lactation threshold almost the same time for the two protocols.

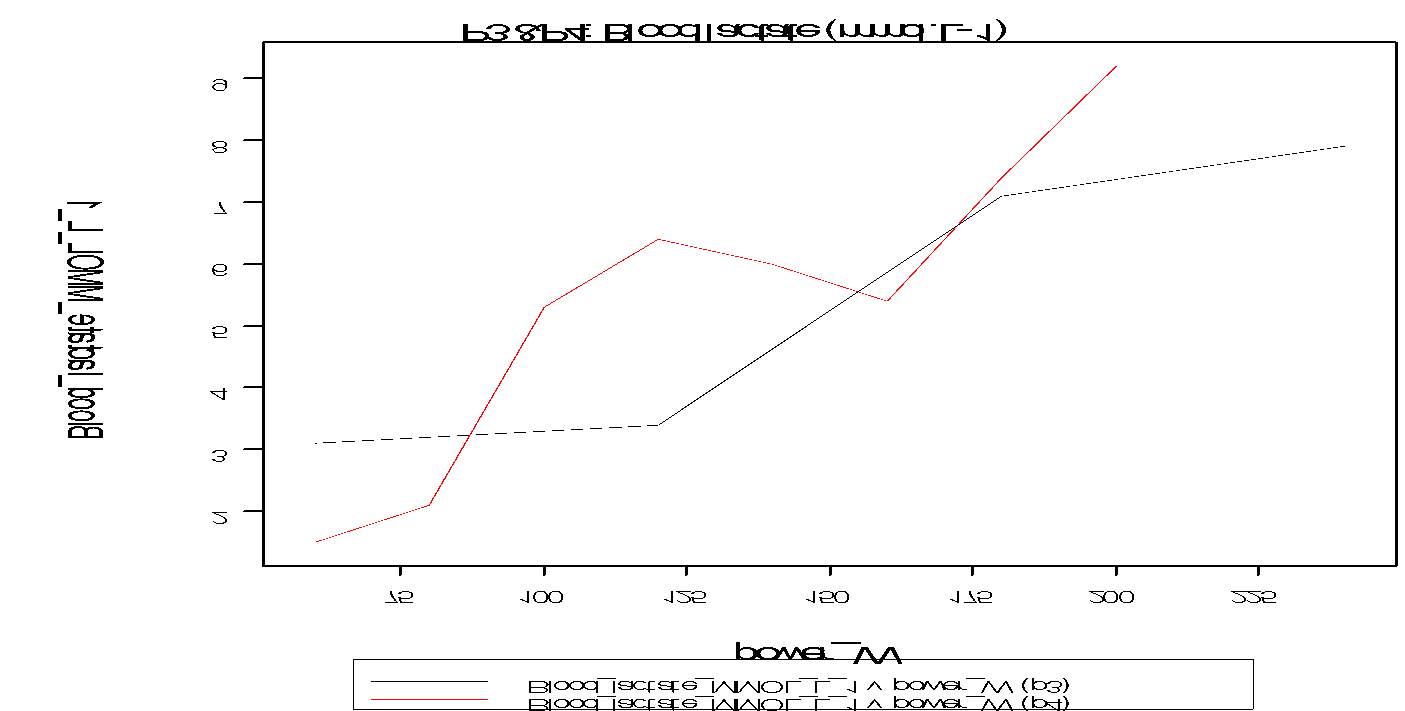
The figure above compares the blood lactase levels for protocol 3(p3) and protocol 4(p4).The blood lactase levels when the subjects intensity is increased by 60W has a gentler aslope as that of the subject whose intensity is increased by 20 W. The subject reaches the LT at much slower pace when the intensity is increases by 60W every 2 minutes as compared to the time when the intensity in increased with 20W every 2 minutes.

There were no big differences in the results given between the 1st and 2nd protocol for the first subject just as there was no big difference between the 3rd and 4th protocol. There was however as difference between the 1st and 2nd protocols used on the first subject and the 3rd and 4th protocol that were used on the second subject.

The athlete tested training for 10K a lactate threshold of 2.2mmoL-1 would be associated with the pace of the race. Thus, a single threshold level cannot be used for two different events, such as a 10K and a marathon. Additionally, the speed recorded for the 4mml.L-1 would not be applicable for a 10K running. This is because athletes cannot effectively sustain the speed blood lactate of 4 mml.L-1 for a relatively longer period. Instead the results indicated that in order for accurate forecasting the 10K and half marathon performance was to graph the results. The figures recorded on the graph are then connected on the basis of best-fit lines. The graphical determination proved more reliable compared to the specific measurement of blood lactate levels.

According to the results, it is not possible to apply a single lactate level for multiple events. Equally, athletes would not effectively sustain the pace associated with a lactate threshold of 4 mml.L-1. However blood lactate levels beyond 4 mml.L-1 during time trials in cycling, means that different sporting activities prompt varied responses from the athletes. Clearly, the 10K race showed the link between performance and testing. Because testing of such levels occurs by progressively increasing the treadmill speed at constant intervals. The athletes tested established that the 10K race was associated with 2.2 mml.L-1, though self taste runs blood lactate levels would climb to 6 mml.L-1.

Reference List

Chad, B., 2009. The scoop of lactase threshold testing. Velonation. 

Ghosh, A. K., 2004. Anaerobic Threshold: Its concept and role in endurance sport. Malaysian Journal of Medical Sciences, 11, (1), pp. 24-36.

Hollman, W., 1959. The relationship between pH, lactic acid, potassium in the arterial blood and venous blood, (PoW) and pulse frequency during increasing spirometric work in endurance-trained and untrained persons. Pan American Congress for sports Medicine Chicago, Chicago.

McArdle, W. D., Katch, F. I. and Katch, V. L., 2001. Exercise Physiology. 5th edn. Lippincott: Williams & Wilkins.

Svedahl, K. and MacIntosh, B. R., 2003. Anaerobic threshold: The concept and methods of measurement. Canadian Journal of Applied Physiology, 28, (2), pp.299-323.

Cite this paper

Select style

Reference

StudyCorgi. (2022, May 10). Anaerobic Threshold: An Experiment. https://studycorgi.com/anaerobic-threshold-an-experiment/

Work Cited

"Anaerobic Threshold: An Experiment." StudyCorgi, 10 May 2022, studycorgi.com/anaerobic-threshold-an-experiment/.

* Hyperlink the URL after pasting it to your document

References

StudyCorgi. (2022) 'Anaerobic Threshold: An Experiment'. 10 May.

1. StudyCorgi. "Anaerobic Threshold: An Experiment." May 10, 2022. https://studycorgi.com/anaerobic-threshold-an-experiment/.


Bibliography


StudyCorgi. "Anaerobic Threshold: An Experiment." May 10, 2022. https://studycorgi.com/anaerobic-threshold-an-experiment/.

References

StudyCorgi. 2022. "Anaerobic Threshold: An Experiment." May 10, 2022. https://studycorgi.com/anaerobic-threshold-an-experiment/.

This paper, “Anaerobic Threshold: An Experiment”, was written and voluntary submitted to our free essay database by a straight-A student. Please ensure you properly reference the paper if you're using it to write your assignment.

Before publication, the StudyCorgi editorial team proofread and checked the paper to make sure it meets the highest standards in terms of grammar, punctuation, style, fact accuracy, copyright issues, and inclusive language. Last updated: .

If you are the author of this paper and no longer wish to have it published on StudyCorgi, request the removal. Please use the “Donate your paper” form to submit an essay.