The Maximum Number of Tickets Sylvia can Buy in a Week
If the budget is $24 and the cost of one movies ticket is $4, the maximum amount to spend on tickets equals the budget divided by the cost of one. Therefore, it will be; $24/$4, which equals six tickets.
The Maximum Number of Pizzas Sylvia can Buy in a Week
If the budget is $24 and the cost of one pizza is $12, the maximum amount to spend on pizzas is equal to the budget divided by the cost of one pizza. Therefore, it will be; $24/$12, which is two pizzas.
The Opportunity Cost of Purchasing a Pizza
The opportunity cost of purchasing a pizza equals the return of purchasing a ticket minus the return of purchasing a pizza. If one ticket is $4 and the total budget is $24, the return of purchasing one ticket is the total budget minus the cost of one ticket. It will be; $24-$4, equal to $20. The return of purchasing one pizza equals the total budget minus the cost of one pizza. If one ticket is equal to $12, it will be; $24-$12, which equals $12. Therefore, the opportunity cost will be $20-$12, which equals $8.
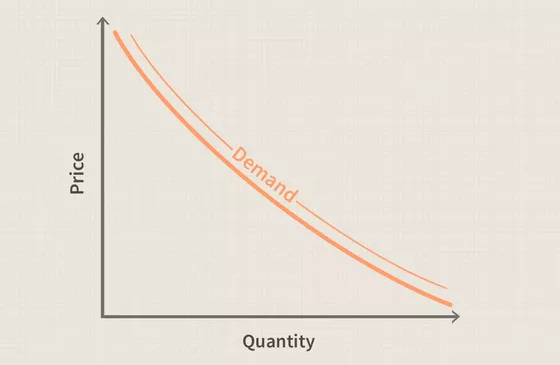
Difference between the Demand and the Quantity demanded of milk
Demand refers to a client’s urge to purchase a product, like milk. Quantity refers to the amount of product that clients are willing to purchase at a certain fee (Stonecash et al., 2020). Consumers’ Demand changes because of their buying behaviour, taste, market trends, alternatives, availability and appeal. The graph is as follows.
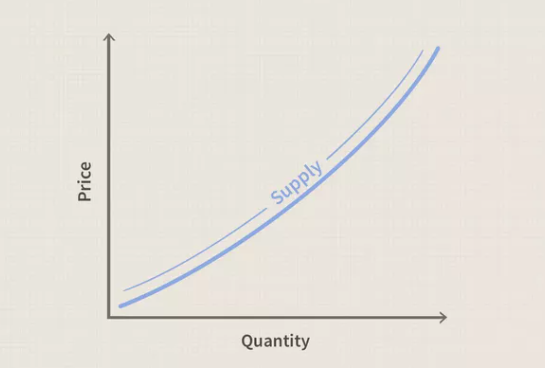
Difference between the Supply and the Quantity of Milk
Supply refers to the total amount of milk available in the market. The quantity of milk is the specific price and amount of product supplied. Supply covers all the price points of milk. When the price of milk is high, the quantity increases. When the price is low, the quantity decreases (Stonecash et al., 2020). The equilibrium creates different price points for a product. It is different from Demand which is inversely related to the quantity of product. The supply and quantity graph is as follows.
Reference
Stonecash, R., Gans, J., King, S., Byford, M., Ivanovski, K., & Mankiw, N. G. (2020). Principles of macroeconomics. Cengage AU.