Introduction
The portrait of the two famous Australian companies have outlined in this paper considering the importance of their WACC (Weighted Average Cost of Capital) and financial risk management strategies for both of their managers. Before going to the theoretical discussion and WACC calculation, it is important to take a precise look of the companies profile over the last fiscal year, 2008.
BHP Billiton
BHP Billiton is dual listed in ASE (Australian Securities Exchange) and LSE (London Stock Exchange), an FTSE 100 Indexed mining company headquartered in London and having operations all over the globe as a major player in the mining industry. The annual report 2008 of BHP Billiton reported that, due to the merger between Australia’s large company BHP (Broken Hill Proprietary Company) and the British company Billiton, it is the world’s largest mining company from 2001.
While considering the growth at first, they rely on fuel and the involving resources – oil, gas, coal, iron ore, manganese, alumina, nickel, copper, and uranium. Besides, they also significantly pay attention on the developing Asian countries for both production and supply of the world market.
- Company objective: the discovering of the long run prime company objective has involved in following the phases
- Development;
- Natural resources renovation;
- Proof innovation provisions to attract customer;
- Resolution considering market focus.
- Production outcomes: Have a large product line that includes- diamond, as well as gold, silver, lead, zinc, both metallurgical and thermal coal for energy supply, iron ore, oil, gas, manganese, both alumina and aluminum, nickel and uranium.
- Number of employees: More than 41,000
- Number of contractors: More than 61,000
- Operating areas: Over 25 different countries including 100 operating areas
- Headquarters: Melbourne, Australia
- Company type: During 2001, through a merger, the BHP Billiton Plc has outlined as Duel Listed Company (DLC) combining the BHP Billiton Limited Group and the BHP Billiton Plc Group. The separate corporate survival and the stock exchange listing of both the companies stayed under same economic umbrella as well as unique executive management structure.
Telstra Corporation Ltd
It is a renowned Australian company operating in the telecommunication field. In the fiscal year 2008, the company has achieved a significant earning growth with their additional improvement within subscriber acquisition and re-contracts costs (SARC) management. Moreover, in both market and consumer segmentation, they have a conscious attention. Following are the phases of their recent business atmosphere during 2008. Products and services available at the Telstra- post paid phone services affiliated with 3GSM network; phone services for the residential consumer include the fixed and wireless broadband, and the G™ network; the mobile data transferring advantages, etc. Another significant secret to boost their earning is contracting costs for higher services (Telstra Corporation Limited Annual Report 2008, pp. 6-24).
- Consumer marketing and channels: With the increase of EBIT (Earning before Interests and Taxes) Telstra’s income, sales, and revenue growth have also improved by 5.3 % and 6.1 % respectively where EBIT has enlarged through 7.6 %. More specifically, among whole customer segment 72.2 % has involved in 3GSM network. Mobile services revenue for the last year was $ 3,432 million and growth at 7 % where both fixed and wireless Internet broadband earned about $ 1,478 million and growth enlargement was 38 %. EBIT contribution margin improved through 0.9 % and the external expenses in the customer segment was also increased by 1.5 %.
- Business: In comparison, the first half of the fiscal year business segment of the Telstra creates more strength during the second half. Regarding this, income growth, EBIT contribution and the sales revenue growth is- 8.8 %, 8.4 % and 8.6 % respectively. Particularly, mobile service revenue is 25.8 % that is 1.61 million increases in SIO’s but a decline of 1.5 % in the PSTN revenue. The 64.9 % postpaid under the SIO base is included in the 3GSM network and on the other hand, 14.7 % increase held in the 3GSM ARPU. In case of wireless broadband Internet, it has boost its growth by the 43.5 %. Considering high-end business consumers’ execution of their service involved in- strong portfolios are IP and direct access to Internet, superior advantages of the Next G™ network. Finally, just 0.1 % decline occurred in the contribution margin of EBIT (Telstra Corporation Limited Annual Report, 2008).
- Enterprise and government (E and G): as other segment of the Telstra Corporation, E and G segment has also boosted their sales revenue and 3.6 % greater than last year. Particularly, this segment contributes 8.4 % in the EBIT sector, increase of income is 3.5 %, and income growth is 4.4 %. Strategy those make aid to do this are- product mix transformation, non-core business selling and simplification. Typically, they focus more on the network transformation program. Compare to the last year, 6.2 % growth occurred in the IP and data access and 21.6 % in the Mobile services. On the other hand, it reduced the external expenses by US$ 1,881 million and labour costs by 11.1 %.
- Wholesale: In the wholesale segment during 2007, their sales volume has reduced by 5 % but in 2008, they overcome all of the dilemmas. In 2007, reduced sales revenue is 4.5 %, 6.6 % EBIT and 18.1 % basic access products but the expense increased by 46.1 %.
- Operation: operation in telecommunication sector is much costly due to its supporting tools. Though the Corporation passed a successful financial year, operation segment has contributed negatively by $3,998 million, and in percentage, it was 2.9 %. Extreme weather condition, increasing labour costs, and highly sensitive supporting service tools are the reason behind that. More than 1,621 employees has contributed efficiently in this segment- who worked in the Call Centre Transformation program and the total workforce is equivalent to 17, 785. Document of the major subsidiaries document are:
- Sensis
- CSL New World
- Telstra Clear Refer
- Other: The other segment of the Telstra executes centre functions on the Corporate affiliated with the evaluation of fixed assets depreciation and amortization and administrative expenses required by the Telstra Entity.
Considering all of these factors, WACC of both the companies has presented in detailed form. Another significant fact is that WACC is the aggregate average form of capital structure in which cost or the proportion of the different capital has plotted. This paper has also described the issued are considered by a financial manager.
Calculation of Weighted Average Cost of Capital (WACC) at 30 June 2008
Formula used in Weighted Average Cost of Capital (WACC) has plotted below:
WACC = [(Proportion of debt, wd x After-tax cost of debt, kd) + (Proportion of Preferred stock, wp x Cost of preferred stock, kp) + (Proportion of Common equity, we x Cost of common equity, ke)
Source of Formula: Besley & Brigham 2007, pp. 349)
Comparison Between the BHP Billiton and the Telstra Corporation
Following are the major factors laid between these two companies WACC (Weighted Average Cost of Capital). Though, they are conducted different business pattern compare to the BHP Billiton, the Telstra Corporation has a strong capital arrangement in all categories of capital sources.
- Cost of debt or amount of loan is greater for the BHP Billiton rather than the Telstra Corporation and the BHP Billiton borrows more than two times greater amount of money than the Telstra Corporation.
- The Telstra Corporation has 8 million preferred stock where as the BHP Billiton has only 0.1 billion.
- In case of common stock, they stayed much nearer toward themselves and there have a petite difference among them. Particularly, the BHP Billiton has 33.6612056 % and the Telstra Corporation 36.90377335 % common stock around their capital structure.
Another source of capital is retained earnings that also known as internal capital equity of firm’s capital. In this capital form, the BHP Billiton has greater stock than the Telstra Corporation. More specifically, with US$ 35,756 million, the cost of retained earnings is 23.4281991% for the BHP Billiton and the Telstra Corporation has $ 6,793 million at 25.8326413 % costs of retained earnings.
The issues during WACC calculation: during calculation of the WACC, have to consider readily both the aggregate and separate identities of different capitals described as bellow and while capitals factors are compact in an aggregate form that would termed as Marginal Cost of Capital (MCC).
Cost of debt, kd: Cost of debt, kd is the interest rate charged on debt and termed as after tax cost of debt (Besley & Brigham 2007, p. 339). Calculation of the cost of debt is as bellow-
Cost of debt, kd = Required rate of return, k x (1 – t); where t = Firm’s marginal tax rate
Cost of preferred stock, kp: According to Besley & Brigham (2007, p. 341), cost of preferred stock is affiliated with the dividend payment on new issuing shares but here does not need to make any adjustment on tax payment. Formula used in estimating cost of preferred stock-
Cost of preferred stock, kp = {Do / (Po – f)}; where Do = Dividend per share, Po = Selling price per share and f = Floating cost
Internal equity or the cost of retained earnings, kr: Besley & Brigham (2007, p. 342) mentioned that in case of debt cost and preferred stock cost firms are mostly rely on the returns of the issued stocks as well as the expected return of the investors. Opportunity cost principle is the concept that includes cost of the retained earnings and the retained earnings is also termed as expected rate of return. Fundamental rules of retained earning id plotted below and therefore, three basic approaches have outlined.
Cost of retained earnings, kr = {(D1 / Po) + g}; where D1 = Dividend per share, Po = Selling price of the share and g = Growth
The CAPM approach: According to Besley & Brigham (2007, p. 343) method used in the CAPM approach for retained earnings or the expected rate of return is:
Ki = [Rf + β {E (xm) – Rf}]; where Ki = Required rate o return on asset, Rf = Risk-free rate, β = Beta and E (xm) = Expected return on Market portfolio
In simpler form, Ki = (Risk-free rate of interest + Risk premium)
Discounted cash flow (DCF) approach: Besley & Brigham (2007, pp. 344) said that calculation of DCF has held through following mode and for long time investment procedure discounted cash flow method is applicable.
Po = ∑ Dt / (1 + k) ^n; where Po = Current price stock, Dt = Expected dividend at the end of year t, k = Required rate of return and n = Number of year
Bond-Yield and the Risk-Premium approach: Besley & Brigham (2007, pp. 346) stated that it has proved through many theories that higher return carries higher risks. In order to risk adjustment this tool is used in calculating cost of retained earnings as bellow-
Required rate of return, K = (Bond Yield + Risk Premium)
External equity or the cost of common stock, ke: Besley & Brigham (2007) said that in case of liquidity crisis, firms crafted their necessary funds by issuing new shares and the sources of this funds is provided by the shareholders who are also termed as external equity provider (pp. 346-348).
Cost of common stock, ke = {(Dividend per share, Do / Price per share, Po) + Growth rate, g}
- Consideration of the financial managers’ fundamental key issues: according to Brealey & Myers (2003, pp. 201-209), for smoother business growth following are the prime consideration of a financial manager-
- Liquidity: Perison, et al (2006, p.187) argued that liquidity is the key factor of marketability, capital resource, new investment establishment and any kind of business operation.
- Risk-free interest rate: Risk-free interest rate brought higher profit margin and regarding this, mangers seek risk-free interest rate to boost their gross margin.
- Market risk: utilization of “β” and considering systematic risks evaluated the market risk and high market risks have a prospect to craft higher return.
- Sensitivity analysis: another issue that enables to evaluate fluctuation of expected rate of return from the expected risks premium and it has referred to as sensitivity analysis.
- Cost of production: low cost of production is advantages for a sound business growth and flexible atmosphere.
- Efficiency in time management: low time for the production of goods and services is another issue to earn more and increase the greater liquidity.
- Labour cost: high labour cost reduces the earning capacity, to get competitive advantage and high profitability.
Literature Review of WACC Calculation for BHP Billiton and Telstra Corporation
WACC of BHP Billiton and Telstra Corporation is the overall required return on the companies as a whole as well as it is frequently applied internally by directors of the firms to find out the economic achievability that may address the opportunities of expansion and financial decision-making. The assets of BHP Billiton and Telstra Corporation are financed by means of either debt otherwise equity. Weighting the average costs of these financing resources by the proportionate utilization of the firms would be considered as WACC. By calculating the WACC of BHP Billiton and Telstra Corporation, it is possible to demonstrate how much interest both the firms are paying for every dollar they finance, and by doing so the financial managers of the firms would be able to investigate capital budget analysis, as well as firms valuation.
Understanding WACC
Brealey and Myers (2003) mentioned that the weighted average cost of capital (WACC) is the overall cost of capital of a company those have utilised the aggregate cost of capital to the company is noticeably pedestal on the average cost of each tools that the company uses to lift up capital from the financial market. To calculate WACC, the cost of capital values of each entity elements are weighted by the respective percentage value of each element in relation to the total volume of financial capital of that company.
Brigham and Houston (2004) added that the weighting method is typically pedestal on the set of book value represented weights where the incomparable amounts for each category of capital elements are getting from the annual balance sheet of that company. To considering debt, the book value is more nearer to the market value than its equity when the market value of equity changes recurrently. The reason for considering book values to weighting the returns of equity is that the book equity stands for the sum of capital those the stockholders have invested and those are included in all paid-in-capital as well as retained earnings rather than distributed dividend of the company.
Bishop et al (2006) has presented the formulas for calculating WACC as follows:
WACC= K d(1-T)W a +K pW p+K e+W e(1)
Where, K d = interest-bearing debts,
K p = preferred stock,
K e = common equity,
W a = weight considered debt,
W p = preferred stock with weight,
W e = weight associated equity,
T = corporate tax,
(1-T) = tax deducted interest expenses.
The formula for calculating WACC can also be indicate as follows
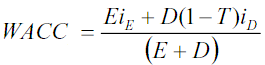
Where, E indicates the Annual Free Cash Flow to Equity, ig has presented annual cost of equity, D represents Annual interest payments before taxes, Id presents annual cost of debt, and T stands for tax rate.
Llano-Ferro (2009) has motivated the WACC formula concerning the value of a firm can be predictable because of adding the Net Present Values of Equity with its Free Cash Flows to Debt each by discounting with the apposite interest rate-
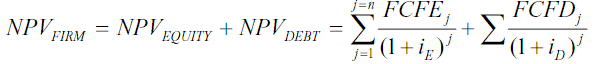
Here FCFE indicates free cash flow of equity, FCFD represents free cash flows of debt, and i stands for interest rate.
Elements of WACC
Brealey and Myers (2007) defined that the capital is the money that firms engage to finance their needs to buying new assets and investing in new or existing projects those engender cash flows when the capital comes from investors by investing in the common stocks or from borrowing sources acknowledged as debt. Thus, the cost of capital has explained as the cost of performing the business of a company. To evaluate the weighed average cost of capital following elements have to consider.
Cost of Equity
Brealey and Myers (2003) pointed out that the Cost of Equity is the investor’s anticipated rate of return that he would earn from taking risks of investing in the shares of a firm, which could be calculated in two manners such as by using Gordon’s Dividend Growth Model and the other is CAPM (Capital Asset Pricing Model).
As per Gordon’s model, the dividends have considered as a fact of rising at a constant rate, and the value of a company stock has deliberated as the sum of all future dividends of the company and formulated as a dividend valuation model for the firms whose dividends have anticipated growing at a constant rate of g. Such as:
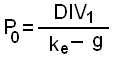
where DIV1=DIV0(1+g)
This equation can be solved for calculating the cost of equity ke as follows-
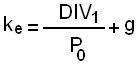
The cost of equity is, thus, equal to the expected dividend yield (DIV1/P0) plus capital gain rate as reflected by excepted growth in dividends (g).
On the other hand, the CAPM theory explains that the relationship of the anticipated rate of return is a gathering of risk free interest rate, the systematic risk beta as well as the anticipated market risk premium that formulates as
Ri =Rf + (Rm – Rf )xβ
Where, Ri = Return on asset,
Rf = Risk free rate of return,
Rm = Rate of return on market,
xβ= Systematic risk.
Cost of Debt
The debts of a firm are frequently an assortment of loans; bonds as well as other securities and the cost of Debts are the amount paid as the interest rate upon the firm’s debt. The most significant note is that the interest a tax deductible expenditure of a firm and accordingly the after-tax rates are as a rule applied for a firm’s cost of debt measurement as:
After-tax Cost of Debt = (1- Tax Rate) X Cost of Debt
Steps to Calculating WACC
Once the component costs have calculated, they should multiply by the proportions of the respective sources of capital obtain the weighted average cost of capital (WACC). The proportion of Capital must base on target capital structure. WACC is the composite or overall cost of capital. (Vélez-Pareja and Tham, 2009)
The following steps are involved for calculating the firm’s WACC:
- Calculate the cost of specific sources of funds
- Multiply the cost of each source by its proportion in the capital structure.
- Add the weighted component costs to get the WACC.
In financial decision-making, the cost of capital should calculate on an after-tax basis. Therefore, the component costs should be after-tax costs. If we assume that a firm has only debt and equity in the capital structure, then WACC (k0) will be:
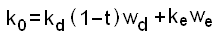
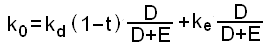
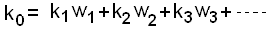
Where k0 is the WACC, kd(1–T) and (ke) are respectively, the after-tax cost of debt and equity. D is the amount of debt and E is the amount of equity. In the general form, the formula for calculating WACC can be written as follows:
- Criticisms: actual price differ from the estimate:
- Unrealistic assumptions: For unrealistic assumptions actual price differ from the estimated.
- Test of CAPM: It is difficult to test the validity of CAPM. For this, estimated price and actual price is different.
- Stability of beta or systematic risk: Beta is measure of a security’s future risk. However, investors do not have future data to estimate data. What they have are past data about the share prices and the market portfolio. Thus, they can only estimate beta based on historical data. Investors can use historical beta as the measure of future risk only if it is stable over time. This implies that the betas are poor indicators of the future risk. For all of these, beta is the one of the factor that does not remain stable over time and estimated value is differed from the actual.
Dilemmas to Calculating WACC of BHP Billiton and Telstra Corporation
There is an implication envisages the relationship between risk and the expected rate of return on a present risky security market provides a framework to price individual securities and determine the required rate of return for individual company and the implications are-
- Market efficiency: The capital market efficiency implies that share prices reflect all available information. In addition, individual investors are not able large number of investors holding small amount of wealth.
- Risk aversion and mean-variance optimization: Investors are risk-averse as they evaluate a security’s return and risk in terms of the expected return and variance or standard deviation respectively. They prefer the highest expected returns for a given level of risk and it implies that investors are mean-variance optimizers and they form efficient portfolios.
- Homogeneous expectations: All investors have the same expectations about the expected returns and risks of shares.
- Single period: All investors’ decisions has based on a single period and the imitated scope to address long-term financial crisis.
- Risk-free rate: All investors can lend and borrow at a risk free rate of interest. They form portfolios from publicly traded securities like shares and bonds.
- Even though the calculation of WACC gives over special space and deliberation to measure debt and equity have kept very small attempt to ensure the correctness of calculation of firm’s values like BHP Billiton and Telstra Corporation where the present valuations are not adequate to dealt with.
- The market values of BHP Billiton and Telstra Corporation have to be calculated on 30 June 2008 which is the present value at WACC based on the future free cash flows, the values to work out D% and E% within the WACC are positioned at the establishment of timeframe t commencing the right information will be applied.
- d(1-T) entail that the payments of tax corresponds in time by means of the interest payments all that implies a dissimilar outcome for the WACC measurement, moreover the continuous of altering macroeconomic environment of BHP Billion’s WACC has transform from system.
Affiliated Theories of Financial Management
- The Markowitz theory or the birth of portfolio theory: In 1952, Markowitz has evaluated the portfolio theory in which he explain the concept is that- “put all of the eggs in one basket” (Brealey & Myers 2003, pp. 1878-196). In simpler form, portfolio is the concept that combined different types of stocks and diversified risks.
- The Capital Asset Pricing Model (CAPM): excluding tax adjustment and transaction costs the CAPM theory identifies the infinitely divisible assets, single time-period, unlimited short sales, lending and borrowings (Brealey & Myers 2003, pp. 196-203). Key advantage of this theory is that provide homogeneous expectation or required rate of return. Method used in this approach has already described in the literature review section of the paper.
- The Capital Market Line (CML): Considering both of systematic and unsystematic risks, this theory makes a bridge or trade off between risk and return (Brealey & Myers 2003, pp. 201-204). The CML equation is-
CML, E (Rp) = Rf + {E (Rm) – Rf} / σm; where E (Rp) = Portfolio return, Rf = Risk-free interest rate, E (Rm) = Market return and σm= Market risk
The Security Market Line (SML): Only considering the systematic risk SML theory, express the trade off between expected return and systematic risks (Brealey & Myers, 2003, pp. 197-198). In other words, graphical presentation of the CAPM theory is termed as the Security Market Line (SML). The SML equation is-
E(Rj) = Rf + {E(Rm) – Rf} βj; where E(Rj) = Portfolio return, Rf = Risk-free interest rate, E (Rm) = Market return and βj = market risk measurement
- Consumption Betas versus Market Betas: Besley & Brigham (2007, pp. 203-204) stated that beta is the measure of risks and market beta evaluates the risks over the market. Greater risks brought greater return and lower risk carries lower return. Another significant point, betas closely relate to the systematic risks of a firm.
- Arbitrage Pricing Theory (APT): In 1976, Stephan Ross has introduced the Arbitrage Pricing Theory (APT) and in which he describes the relationship between risks and returns. Since this theory has grounded on the pure arbitrage arguments, it has named as the APT (Arbitrage Pricing Theory). Considering the investors preferences assumptions of this model is highly focused on expected returns’ equilibrium theory for the securities and this is the prime assumption of this theory (Brealey & Myers 2003, pp. 204-208). Modes of APT theory is-
E(r) = β1 x E (r1) + β2 x E (r2) +……… + βn x E (rn), where, β = Market risk measure, E(r) = Expected return and n = number of year
The Three-Factor model: Brealey & Myers (2003, pp. 208-210) argued that Fama and French (1995) evaluated three-factor model regarding to overcome of the limitations of the CAPM model. This model has developed through three sequential steps as described bellow long with the equation of this model. Finally, calculation of expected return is as approximately as the APT (Arbitrage Pricing Theory).
(r – Rf) = [{market (b) x market factor (r)} + {size (b) x size factor (r)} + {book-to-market (b) x book-to-market factor (r)}]
Step 1: Identification of the factors: At first stage, factors stayed in the above equation is evaluated through following calculation and these factors fosters the estimation of expected return
Step 2: For each type of factor, calculate the risk premium: Calculation of risk premium involved in the difference between the annual return on stocks considering both of the high and low return on book-to-market ratio.
Step 3: Calculation of the factors Sensitivities- while considering different stocks during the same period some behaved more sensitive than other based on the three factors and the expected return is always differ from the expected risk premium.
Additional Parts
The cost of equity (Required rate of return on equity) under CAPM: According to CAPM approach, cost of equity need to consider risk free rate (Rf), Beta (β) of the firm or market risk, and market return. Following is the equation to calculate required rate of return on equity or the cost of equity (Bishop et al 2004).
Required rate of return on equity = Risk-free rate, Rf + Beta of the firm, β x (Return on market − Risk-free rate, Rf)
Calculation of Beta (β) based on market: considering the financing source of a firm levered Beta is calculated either by WACC approach or through CAPM theory. However, feature of the BHP Billiton and the Telstra Corporation’s investment has assembled through both debt and equity calculation of Beta (β) has executed here by following instructions (Bishop et al 2004)).
Levered Beta, β = [1 + {D x (1 – γ) Corporate tax, t}/ E} x βu
Here, D/E = Dividend per share
γ = Effective corporate tax
t = Corporate tax
E = Earning per share
βu = Unlevered Beta
- The company return: return of an organization measured through the net sales, revenue, earning before tax and interest payment and earning after tax and interest payments.
- Estimation of Gama, γ: Gama, γ is the percentage of effective corporate tax. Effective corporate tax would pay in terms of franked dividends (D).
- Cost of debt: cost of debt is the loan value borrowed by a firm different source and it might be either bank loan or from the investors. Following are the tools of calculating cost of debt. In calculating debt, both short term and long term debt has to be considered. Another significant issue, total value of the firm and equity has determined the proportion of debt.
- Total debt = (Short term debt + Long term debt);
- Value of an organization = (Debt + Equity);
- Proportion of debt = (Total debt / Total value of the company);
- Cost of debt = (Risk-free rate + Default risk premium).
- Preference shares: calculation of WACC requires considering preference shares as an important component of capital sources. Required return on preference share is measured through as bellow.
Preference shares required rate on return = (Dividend per share/Share price per share).
Conclusion
The motto of this paper is to calculate WACC of the two Australian firms- the BHP Billiton and the Telstra Corporation. These two have operated different business functions. The BHP Billiton deals with the natural resources toward energy supply and on the other hand, the Telstra Corporation demeanor telecommunication business. Concerning the market survey based on their annual report it has noticeably assumed that market position of these two firms are enough strong. In comparison, the BHP Billiton has lower WACC rather than the Telstra Corporation. At the end of the WACC calculation, it has also described the components of the WACC theoretically, thereafter a brief comparison has plotted between them, as well as the significance considering issues focused by the financial manager in deciding how to execute any project, and finally, the affiliated theories of the financial management are discussed.
The effects of the WACC calculation of these Corporations have exhibited a set of significant points those act as an aid to make investment decisions or transformation of business track. The above calculation evaluated that annual reserve or the retained earnings of the BHP Billiton are almost five times greater than the Telstra Corporation. This figure noticed that cost of capital of the BHP Billiton is lower than the Telstra Corporation. Consequently, amount of debt or loan value is also greater for the Telstra Corporation. More specifically, the merit of the lower cost of capital includes- lower interest payment against debt, sound tax burden, capability to make high reserve or the retained earnings as well as low weighted average cost of capital (WACC).
Reference List
Besley, S., & Brigham, E. F. (2007) Essentials of Managerial Finance. 13th edition. Thomson South-Western.
BHP Billiton Limited. (2008) Resourcing the Future: Annual Report 2008 of BHP Billiton. Web.
Bishop, S. et al (2004) Corporate Finance. 5th Edition. Pearson Education Australia.
Brealey, R. A. & Myers, S. C. (2003) Principles of Corporate Finance. 7th edition. McGraw-Hill.
Llano-Ferro, F., (2009) The Weighted Average Cost of Capital (WACC) for Firm Valuation Calculations. International Research Journal of Finance and Economics. Issue 26. Web.
Telstra Corporation Limited. (2008) Annual Report 2008 of Telstra. Web.
Vélez-Pareja, I. and Tham, J. 2009. New WACC with Losses Carried Forward for Firm Valuation. Web.