Introduction
Population is a widely studied topic in statistics. It involves collecting data of certain societies or regions regarding sub-topics such as birth rate, population growth, comparison between two groups, and many others. The analyzed data is significant to the government as it makes certain crucial decisions regarding the factors that influence population change in specific persons or regions. We have based our research on the United States of America (USA). The U.S. is however experiencing a large population increase which is associated with a major shift toward a population composition that is more likely to belong to a non-white or Hispanic minority group. As we turned in 1900, the population of the U.S. was composed of 87 percent whites with the nonwhite community, primarily the blacks who lived in the rural south. At the end of the century, non-Hispanic whites accounted for less than 75 percent of the whole population. The minority group is consists of Hispanics (blacks), Asians, and the growing American Indians population. By the middle of the next century, the term ‘minority’ will have a very different meaning (Frank, Bean, and Marta 7). In Short, the United States (U.S.) is today amid large population increases which are associated with major shifts toward a population that most likely belongs to a non-white or Hispanic minority group (Reynolds 17). On examining this fact, the experience of the American children will concur to that of minority children who live in a society in a society where children constitute a decreasing proportion of the potential dependant population and the elderly constitute an increasing proportion of the potential dependent population. However, for the minorities group, the economic support will depend on the quality of education, health care and training they received when they were children. The U.S. has the highest number of migration with many foreigners moving randomly from one state to the other. Our work aims to summarize the change of population in the USA using the statistical approach and answer the question, ‘is the number of Americans growing or that of minorities’?
Total population of USA (annual average)
In the year 2000, 281.4 million people were counted in the U.S. which was a 13.2 percent increment from the 1990 census population of 248.7 million. The growth varied geographically with some areas experiencing a high growth rate and others a population decline. The census report highlighted population size and distribution changes in regions, states, countries and large cities. In addition, the 1990-2000 census population increase was the largest in the U.S. history. Previously census-to-census recorded an increase of 28.0 million between 1950 and 1960. This high increase was fueled by the post-World War II baby boom between the years 1946 to 1964. From this peak, the growth rate declined significantly until the 1990s (O’Hare et al.).
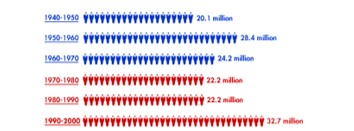
As can be seen from Figure 1, the ‘baby boom increase’ was exceeded in 1990-2000. The increase was not because of the American babies but because Congress had increased the immigration level four times the traditional level. In addition, the federal had softened illegal immigration and this led to an increase in illegal foreigners in the States. Further, the increase was enhanced by the high birth rate of the minorities which was compared to the Baby Boom of the 1950s. The increase came barely after three decades after the country had experienced a stable population. This alarming news brought congestion in schools, spaces as well as tight restrictions on the person’s liberty to keep the population in order. Since the population growth was steered by the federal-forced-growth policies which have not been changed to date, the Census Bureau has reported that America will experience a similar population boom unless Congress intervenes. Population structure The American population tripled over the century rising from 76 million in 1900 to 250 million in 1990. The census bureau has approximated an increase of 140 million by 2050. However different age groups, for instance, children under 18 years, adults between 18-64 and elderly persons aged 65 years old experienced very different rates of increase. In 1990, the children accounted for a much smaller proportion of the population compared to the elderly people. This trend is expected to continue until the mid-next century. Census Bureau has shown that between 1900 and 1990, the proportion of the population accounted for by adults of 18-64 years declined within a range of 55-63 percent. Children on the other hand experienced a steady decline in population with the elderly increasing in their share of the population. Whites accounted for 88-90% between 1990 and 1970. This proportion fluctuated through a steady decline which is expected to continue until at least 2050. By 1980, it became possible to distinguish the majority-white from the minorities groups. Examining Figure 1, about 74% of children were white, not Hispanic and this declined to 69% by 1990. Many institutions have suggested the possibility of this percent decrease to 50% by 2030. On the same note, projections have indicated that adult whites (18-64 years) may experience a decline of 81 to 59 percent and for the elderly from 88 to 75 percent. That is, the number of non-white races (Hispanic) will double for all the age groups (Marden, Meyer, and Madeline 3).

Race and ethnicity
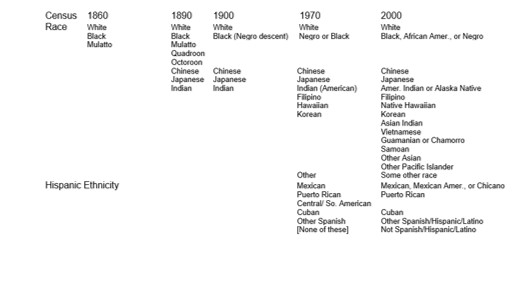
By definition, a racial group is distinguished by physical characteristics such as hair type, facial features and skin color. Ethnicity refers to the social and linguistic background as well as the physical appearance. In the U.S. categories of race and ethnicity varies from one society to another and they change concerning time. Table 1 below shows exclusively the different races from 1860 to 2000. From the same table, an increase in the number of races was experienced in the U.S. during that time. However, in the coming years, it will be difficult to carry out a census on races and ethnic groups since people will be allowed to choose more than one racial group (Marger 284).
Table 1: Race and Ethnic Categories in Selected Decennial Censuses
Size and growth of minority groups
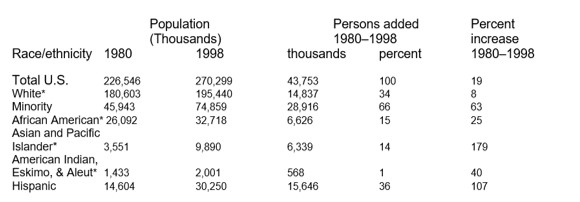
The population of the four minority groups was estimated at 74.9 million in 1998. However most of the century has experienced a high number of black as part of the minority’s population. Between 1900 and 1950, the minority share remained at about 13 percent. The number of minorities surged from just under 10 million to nearly 21 million in the first half of the century. But the non-Hispanic white population grew just as rapidly because of high birth rates and immigration from Europe, which kept the minority share about the same. Between 1950 and 1998, the minority population more than tripled in size as waves of immigration from non-European countries, higher birth rates among minorities, and a relatively young age structure accelerated the minority growth rates as illustrated in Table 2. However, the non- Hispanic white population experienced a considerable decline after 1970 because of low birth rates fell and a decrease in immigration from Europe. Between 1980 and 1998, the minority population increased 63 percent, compared with an 8 percent growth of the non-Hispanic white population (Frank, Bean, and Marta 43). Minorities now consist of one-fourth of the U.S. population (Table 2).
Sources of population
The United States enormous population has been accounted for more than one-third of the growth by the minorities since 1980. Apart from the factor of immigration causing the alarming increase, black women are more fertile than the whites making the minorities’ birth rate higher than that of the whites. On the other hand, the demographic profile is therefore affected by immigration, fertility and mortality (O’Hare et al.). The reason for immigration is the economic opportunities in the U.S. Others may come to visit their relatives already living here. However, we have a great number of illegal immigrants who slipped into the country without proper documentation. The other streams of immigrants from Southeast Asia are accounted for by the refugees who escape their country. Their stay is tied to the U.S. policies after the Vietnam War and the unstable political condition in their home countries. The brisk growth rate of the minority population is sustained by immigration. Most recent statistics from the Census Bureau anticipate 820,000 immigrants a year until at least 2050. This will include; 350,000 Hispanics, 226,000 non-Hispanic Asians, 186,000 non-Hispanic whites, and 57,000 non-Hispanic blacks. The annual increase in minorities’ immigration will shift from 28 percent in 1998 to 47 percent in 2050. However immigration may change by either slowing or accelerating depending on the economic trends or new immigration laws. Another key factor that has caused an increase in the minorities is high fertility than the whites. Minorities contributed 40 percent of the 3.9 million U.S. births in 1997, although they made up only 28 percent of the population. Most back women are in the childbearing age and tend to have more children than the non-Hispanic white women. African Americans have had higher fertility rates than whites throughout the 20th century. Many of the “new minorities” tend to come from countries where large families are the norm. For instance, in Mexico and Vietnam, women have three children on average and in Africa, one can have up to from four to eight on average. The average for U.S. whites has been two or fewer children since 1972. Wealth and poverty The disadvantaged position that minorities hold in the United States is exemplified by their low economic status. Minorities tend to earn less than whites, even when they have similar educational levels, and they possess far fewer material and financial assets than whites. These have been attributed to the level of education between the Americans and the minorities. Statistics have shown a marked improvement in the health status of whites compared to minorities. The difference is attributed to lower socioeconomic status and limited access to better health care. Consequently, the recent life expectancy between the whites and the blacks shows a wide racial gap. In 1997, the average life expectancy at birth was 77.1 years for whites (including Hispanics) and 71.1 years for blacks, the highest levels ever for both groups. Among women, death rates from diabetes, a disease exacerbated by poor nutrition and health care are noticeably higher among blacks, Hispanics, and American Indians than among Asians or whites. Minority women also face a greater risk of dying from infectious diseases or homicide than white women, but they have a lower risk of dying from suicide. Inadequate prenatal care, higher death rates, and other health problems among a sizeable segment of the minority population stem in part from their limited access to health insurance and, consequently, to medical care. Minorities are much less likely than whites to have health insurance (Tamayo 15). Conclusion Now with no doubt we can conclude that the population of the minorities since World War II experienced a considerable increase. The intense birth rates, heavy traffic immigration and relatively young age structure of the minorities will continue to make the U.S. population more racially and ethnically diverse. The national character of America will thus be shaped by the minorities by adding diversity to schools, workplaces and legislatures. With the minorities already forming a large proportion of the population, policymakers need to recognize the complexity of this population and formulate new ones(Marden, Meyer, and Madeline 56).
Work Cited
- Frank, D., Bean, and Marta, Tienda. The Hispanic Population of the United States New York: Russell Sage Foundation, 1987.
- Marden, F., Gladys, Meyer, and Madeline, H. Collins. Minorities in American Society. New York: HarperCollins, 1992.
- Marger, N. Race and Ethnic Relations, 2d ed. Belmont, CA: Wadsworth Publishing Co., 1991. National Center for Health Statistics, “Deaths: Final Data for 1997,” by Donna L. Hoyert, Kenneth D. Kochanek, and Sherry L. Murphy, National Vital Statistics Reports 47, no. 19 (1999).
- O’Hare, W., Jane-yu L., Roy C. et al. Blacks on the Move: A Decade of Demographic Change. Washington, DC: Joint Center for Political Studies, 1982
- Population Reference Bureau analysis of the 1998 Current Population Survey.
- Reynolds, Farley. The New American Reality. New York: Russell Sage Foundation, 1996.
- Tamayo, Juanita. Asian Americans: From Racial Category to Multiple Identities. Walnut Creek, CA: Altamira Press, 1998.
- U.S. Bureau of the Census, 1990 Census of Population, General Social and Economic Characteristics: United States 1990 CP-2-1, Washington, DC: U.S. Government Printing Office, 1993.