Selected Company
Horace Anderton Clarkson formed Clarkson PLC (Clarksons) as a shipping service provider in 1852. The headquarters of the company is located in St Katharine Docks, London, and Andi Case is the present Chief Executive Officer. The main activity of the company is to act as a negotiator between buyers and sellers of vessels, charters, and ship owners. However, there are four main operations of the company including financial, support, research, and brokerage. The company follows International Financial Reporting Standards (IFRS) issued by International Accounting Standards Board (IASB) and adopted by the European Union and the UK for accounting and reporting of financial statements. The core values of Clarkson PLC are integrity, excellence, and fairness to all individuals and businesses. Clarkson PLC earned net revenue of £306.1 million in 2016 from its 49 offices located in different cities, and there are 1,398 employees serving its clients worldwide (Clarkson, 2018a).
Profitability Ratios Analysis
The profitability trend shown in Table 1 indicated that Clarkson PLC gradually increased its total revenues during 2012-2016. The company recognized the commission revenue according to IAS 18 that depends on two main conditions (Clarkson, 2017a). According to IAS 18, “the company’s revenue is recognizable only when it is probable that economic benefits are derived by its clients, and the amount of revenue can be reliably measured” (Deloitte Global Services Ltd., 2017). The trading profit showed adjustments to the revenue due to the direct costs related to other organizations or individuals. An increasing trend was also noticed in the company’s profit starting from 2013 that continued till 2016. The main cause for the increase in the net profit was the company’s strict control over its expenditures. The company did not incur additional investments or unusual expenses in the last two years, and it had consistent revenue growth.
Table 1: Profit trend.
Table 1 provides the profit trend of Clarkson PLC in the last five years. The profitability trend can also be noticed in Figure 1 that showed there was a persistent increase in the company’s revenue, trading profit, and net profit for the year in the last five years. The increasing trend of profitability indicated that Clarksons’ vision is to reinvest its retained profit in training and development programs that support profitability growth (Clarkson, 2018c). Furthermore, there was a significant increase in the volume of brokerage transactions of the company that also resulted in higher profitability.
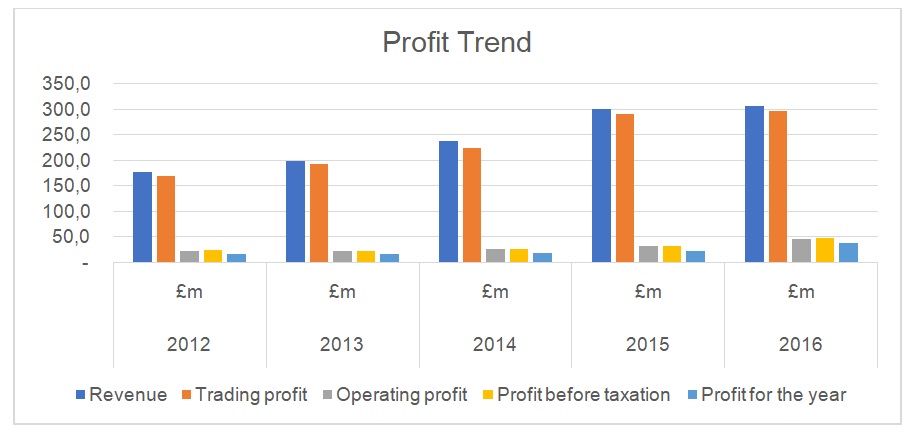
Figure 1 depicts the profit trend of Clarkson PLC indicating that the company experienced significant profit growth during 2012-2016. The profitability trend of Clarkson PLC can also be noted in Table 2 that provides values of different profitability ratios. The values of the gross profit margin ratio indicated that the company managed its direct costs efficiently in the last five years. However, a sudden fluctuation was noticed in 2014 due to the recognition of high inventory cost of £9.8 million as compared to £3.1 million in 2013 (Clarkson, 2018c). However, Clarkson PLC sustained its operating profit margin in 2016 that continuously declined during 2012-2014. The main cause for the increase in the operating profit margin was the adjustment of taxation on acquisition-related cost that also resulted in a lower tax rate of 19.8 percent (Clarkson, 2017a). In fact, the company recognized unrealized losses as the decrease in deferred tax assets in the subsequent year according to IAS 12. It is recommended that the company can continue working on consolidation of its business divisions to reduce its operating costs and sustain its current operating profit position.
The trend of net profit margin showed that there was no significant progress made by the company to lower finance costs related to pensions until 2015. A major positive change noticed in 2016 was due to the decline in finance costs and pensions. The main cause of the decrease in finance costs of the company was that the expected return on its scheme’s assets matched its interest obligations (Clarkson, 2018c). The high fluctuation noted in the return on assets of Clarkson PLC was due to the changes in economic and market conditions. Most of the assets of Clarkson PLC were intangibles that were recognized at the time of acquisition. Clarkson PLC recognized these assets at their fair value according to IAS 38 that requires adjustment for the impairment loss after the year of acquisition (Clarkson, 2017a). The return on equity of Clarkson PLC persistently declined during 2012-2015. However, there was an increase in 2016 in the return on equity of the company due to the positive change in its equity reserves. The main reason for the increase in the company’s reserves was the effect of a devaluation of the British Pound against foreign currencies as significant portion of its total revenue was generated from its operations in other countries. Therefore, the decreased currency value resulted in increasing the value of the company’s total reserves.
Table 2: Profitability ratios.
Dividend Analysis
The dividend analysis of Clarkson PLC is summarized in Table 3 that include values of various dividend ratios. A consistent approach is noticed in the dividend policy of Clarkson PLC as there was a gradual increase in dividends paid to shareholders, which also showed that the company followed its vision of fairness to its investors (Clarkson, 2018c). In contrast, there was a decline in Earnings per Share (EPS) of Clarkson PLC in 2015 and 2016 due to the issuance of new stocks in the financial market to generate additional funds. However, the fluctuation in the share price of Clarkson PLC during 2012-2016 indicated that there was an increase in 2015 due to the company’s acquisition of its major competitor company in Norway. The decline in the share price of Clarkson PLC was also attributed to the economic changes such as distrust of foreign investors on the government’s decision of Brexit.
The value of the dividend pay-out ratio increased in 2015 and 2016 as the company paid a high return on investment to its shareholders (Yahoo! Finance, 2018). The increase in the dividend pay-out ratio value was also associated with the increase in the net profit of Clarkson PLC. However, there was a decline in the dividend pay-out of the company during 2012-2014 as it intended to retain its earnings for future growth. The increase in the dividend yield in 2016 was due to the fall in share prices followed by the threat of Brexit. There was an inconsistent fluctuation in the values of the price-to-earnings ratio of Clarkson PLC. The situation was unfavourable in 2014 when the share price of the company declined. However, the situation was improved in 2015 and 2016 as the market showed signs of recovery, and the company also reported an increase in its net earnings (Clarkson, 2018a).
Table 3. Dividend analysis of Clarkson PLC..
Financial Stability and Liquidity
Table 3 presents the values of liquidity and financial stability ratios of Clarkson PLC in the last five years. The values of the debt to equity ratio indicated that Clarkson PLC only borrowed in 2015 and paid off a certain part of the principal amount in 2016. It was a good sign for any company and its shareholders as all earnings could either be retained or distributed to investors (Brigham and Houston, 2016). The main reasons for the improvement in the company’s financial leverage were the issuance of new shares in 2016 and the increase in its reserves (Clarkson, 2017a). However, there was a decline in the assets to equity ratio value in 2015 and 2016 due to the significant change in the total equity of the company. The times interest earned ratio indicated Clarkson PLC was more efficient in 2016 than 2015, which was due to the increase in its revenues and profitability.
There was a decline in the values of current and quick ratios of Clarkson PLC in 2015 and 2016. The main reason for the decline in these ratios’ values was that Clarkson PLC incurred a short-term liability in 2016 due to the increased demand for brokerage services in the global shipping market. Clarksons also built new relationships with other businesses to fulfil the demands of its clients (Clarkson, 2017a).
News
In 2014, the company acquired its competitor company RS Platou, which was a leading Norwegian company, for £281.2 million. The acquisition generated multiple synergies for the acquiring company, and its position in the shipment investment banking sector boosted its sales and profit (Lewin, 2014). However, the company reported its concerns related to the slowdown in the global shipping trades and subsequent decline in freight rates that affected its revenue in 2016 (Farrell, 2016). In response to the profit warning issued by the company, the equity market responded pessimistically and its shares lost almost 20% of their value. The company after the acquisition of Platou is licensed and operating under the regulations of Financial Supervisory of Norway (FSA) and providing investment banking services to shipping companies (Clarkson, 2018b).
The company announced that it is consolidating divisions of the parent company and RS Platou. It would allow the company to deal with the growing demand for renewable projects in emerging markets (Clarkson, 2017b). Panchal (2017) reported that there was a breach in one of the companies’ computer system that resulted in the loss of vital information. Although the company has closed down this system, it could have negative implications for its business. The shipping industry had been affected by the slowdown in the demand for its services that put companies under financial pressure. However, it has been reported that the market is recovering, which gives the opportunity to Clarkson PLC to increase its sales and profit (Laniyan, 2017). Another report indicates that the company has benefited from the increaing shipping rates as a result of the market recovery (Clark, 2017).
Analysis
A recent analyst report has indicated that the company is expected to achieve its revenue and profit targets for the year ended December 31, 2017 (StockMarketWire, 2018b). It is the reason that analysts including JP Morgan Cazenove have upgraded their estimate of the company’s stock price (StockMarketWire, 2018a) and are optimistic about its business as the industry makes a recovery. The current stock price of Clarkson PLC is £30.50 and its 52-week low was £21.98 (Financial Times, 2018). It implies that shareholders can expect to have a capital gain on their holdings in the company’s stocks. Experts are of the view that Clarksons has been successful in its acquisition and business strategies that would help the company to meet its financial targets in the current period (Laniyan, 2018). It implies that the company has benefited from the recovery of the shipping industry. Moreover, the company’s consolidation strategy would ensure that its position in emerging markets becomes strong in the coming years. The positive news about the company’s financial results would have a direct impact on its stock price. It could be stated that the loss of information is a serious issue for the company. It needs to re-evaluate the security of its information systems and ensure that there is no breach of data in the future as it could also lead to litigation against the company.
Corporate Governance
Clarkson PLC follows the listing rules for public limited companies and provides details of its corporate governance policies and practices required by the provisions of the UK Corporate Governance Code. The corporate governance statement of the company indicated that it was prepared after evaluating the company’s going-concern position according to the provision C.2.2 of the UK Corporate Governance Code (Clarkson, 2017a). The management evaluates different risks faced by the company and estimates their impact on its business. Furthermore, the management indicates the strategies and steps that it carried out to mitigate the impact of these risks and to ensure the viability of the company’s operations. Thus, it is the responsibility of the board of governance to assess the company’s internal controls and ensure that directors are fulfilling their responsibilities.
It is also noted that the company has set a period of three years for assessing the viability of its business, which is a short period for assessment. The governance disclosure indicates the composition of the company’s board and oversight committee. The UK code requires public limited companies to have non-executive, independent directors on the board of governance (Financial Reporting Council, 2016). Likewise, it could be indicated that Clarkson PLC had five non-executive directors, who participated in four annual meetings organized by the company’s leadership. The key areas of focus include “strategy and management, financial reporting and controls. shareholder communications, and executive remuneration” (Clarkson, 2017, p.52). Overall, the corporate governance of Clarksons seem sufficient, but it could provide additional details about the association of directors with other companies, their age, and out-of-pocket expenses that are made for meetings and facilitating independent directors to contribute to the governance board should have been provided by the company.
Asset Value
The net assets of Clarkson PLC were £406.70 million in the last accounting period. It could be noted that the company’s total assets increased significantly in the last two years, which were due to the acquisitions made by the company. These acquisitions helped the company to expand its business. Moreover, the company consolidated its operations to increase effectiveness and efficiency of its business functions. The number of outstanding shares in 2016 was 30.13 million. Based on the calculation provided in Table 5, it could be indicated that the net asset value per share was £13.50, which was much less than the current share price of the company. Moreover, the share price on December 31, 2016 was £21.70, which was also more than its net asset value.
Table 5: Net asset value.
Based on the finding, it could be stated that the company’s shares are overvalued. Any disruption in its business or slowdown in the industry or markets where the company operates could lead to a decline in its share price. Therefore, there is no investment opportunity recommended to buy the company’s shares based on the difference between the net asset value and current stock price of Clarkson PLC. However, it is noted that the company’s stock traded at high multiples of EPS in the last five years, which suggested that investors had an optimistic view of the company’s financial capability and stability. Therefore, it is also recommended to maintain a hold strategy and do not sell the company’s shares.
References
Brigham, E.F. and Houston, J.F. (2016) Fundamentals of financial management. 14th ed. Boston: Cengage Learning.
Clark, A. (2017) Extra: Clarkson profit increases as shipping market rises from depths. Morning Star. Web.
Clarkson. (2017a).
Clarkson PLC Annual Report 2016. Clarksons. Web.
Clarkson. (2017b) Clarksons Platou consolidates renewables experts into global division to meet growing market needs. Clarksons. Web.
Clarkson. (2018a) Clarkson – about us. Clarksons. Web.
Clarkson. (2018b) Investment banking. Clarksons.
Clarkson. (2018c) Investors – five-year financial summary. Clarksons. Web.
Deloitte Global Services. (2017) IAS 18 – revenue. IAS Plus.
Farrell, S. (2016) Shipbroker Clarkson issues profit warning after fall in global trade. The Guardian.
Financial Reporting Council. (2016) The UK corporate governance code – April 2016. FRC.
Financial Times. (2018) Clarkson PLC – market data summary. FT. Web.
Laniyan, D. (2017) Top news: Clarkson profit, revenue grows amid shipping market recovery. Morning Star. Web.
Laniyan, D. (2018) Top news: Clarkson says 2017 results will meet expectations. Morning Star. Web.
Lewin, J. (2014) Clarkson to acquire Platou amid shipbroking consolidation wave. FT.
Panchal, T. (2017) News Clarkson Says confidential data may have been released due to hacking. Morning Star. Web.
StockMarketWire. (2018a) Broker forecast – JP Morgan Cazenove issues a broker note on Clarkson PLC. Stock Market Wire. Web.
StockMarketWire. (2018b) Clarksons on track. Stock Market Wire. Web.
Yahoo! Finance. (2018) Clarkson PLC (CKN.L). Yahoo! Finance.