Introduction
This paper is divided into two sections. The first part will focus on the financial analysis of two companies, JD Sports Fashion PLC and Sports Direct International PLC. Both are based in the UK but have a presence in other parts of the world and both trade in leisure and sports apparel. As part of the analysis, ten ratios will be calculated for each company. These ratios will then be interpreted, and a recommendation will be made on which company to invest in.
Various ways of improving the performance of the poorly performing company will be suggested. Finally, the limitations of ratio analysis will be discussed. The second part of the paper will focus on capital investment appraisal. Three techniques will be used to appraise two projects, and a recommendation will be made on the most viable project to invest in. Finally, the limitations of using capital appraisal techniques will be discussed.
Financial Analysis
Ratio Analysis
Table 1. Calculation of Ratios.
Analysis of Performance
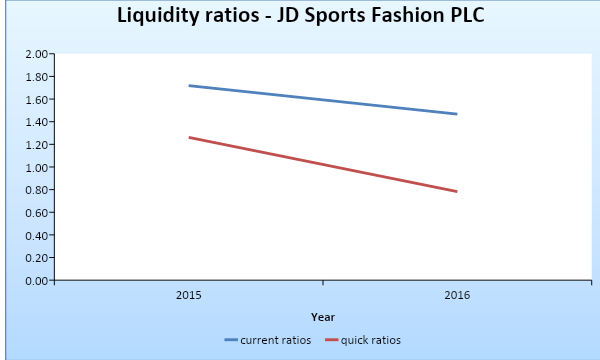
The liquidity of both companies will be evaluated using the current and quick ratio. These two ratios give information on the ability of a company to meet immediate obligations using short-term assets. They also measure a firm’s ability to manage working capital. The current ratio for JD Sports Fashion PLC dropped from 1.72 in 2015 to 1.47 in 2016, while the quick ratio decreased from 1.26 in 2015 to 0.78 in 2016 (Figure 1). This signals a decline in the liquidity level of the company.
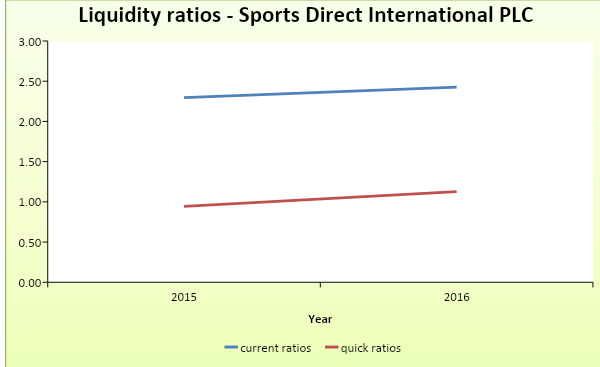
On the other hand, the current ratio of Sports Direct International PLC rose from 2.30 in 2015 to 2.43 in 2016. Similarly, the quick ratio rose from 0.94 in 2015 to 1.13 in 2016 (Table1). The liquidity position of the company improved (Figure 2). A comparison of the two companies shows that Sports Direct International PLC has a better liquidity position than that of JD Sports Fashion PLC.
The second category of ratios that will be analyzed is profitability. This set of ratios gives information on the earning power of a company. That is how a company can successfully generate revenues and convert them into profit. Therefore, the ratio analyzes the efficiency of pricing strategies that are used by a company and the effectiveness of cost management. The ratios that will be analyzed within this category are returned on capital employed, gross, operating, and net profit margin.
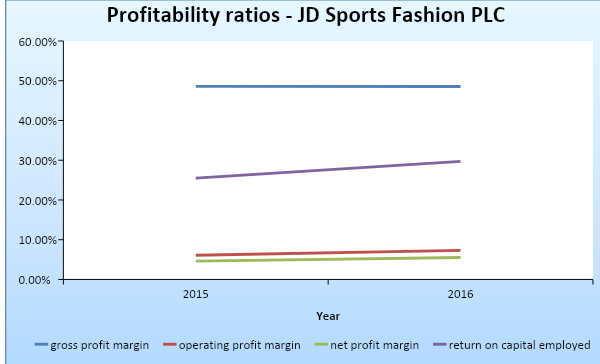
The gross profit margin for JD Sports Fashion PLC dropped slightly from 48.6% in 2015 to 48.5% in 2016. This decline can be explained by the fact that the cost of sales grew by a higher proportion than revenue. A disproportionate increase in the cost of sales can be caused by factors that are exogenous to the company. The decrease in the value of the ratio indicates that the profitability level dropped. The operating profit margin for the company improved from 6.1% in 2015 to 7.3% in 2016.
This can be attributed to growth in both operating profit and revenues. It shows an improvement in the ability of the company to manage operating expenses and to generate revenue for non-operating segments. The net profit margin also increased from 4.6% in 2015 to 5.5% in 2016. Finally, return on capital employed rose from 25.50% in 2015 to 29.70% in 2016 (Table 1). The values were high, which imply a high profitability level.
This ratio gives information on the efficiency of the company is using the available resources to generate revenues and profit (Horner 2013). Thus, profitability ratios for JD Sports Fashion PLC had an upward trend except for gross profit margin (Figure 3). These findings signify an improvement in profitability.
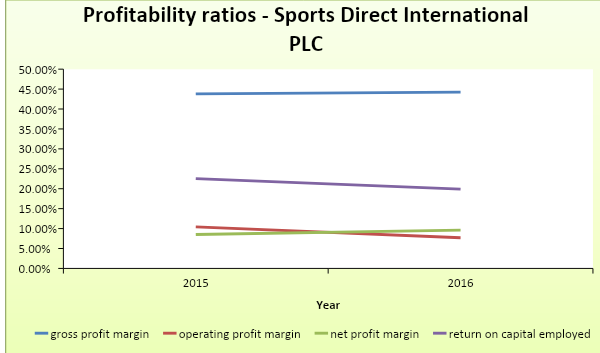
In the case of Sports Direct International PLC, the gross profit margin increased from 43.8% in 2015 to 44.2% in 2016. This can be explained by the fact that the revenues grew by a higher proportion than the cost of sales. The growth signifies an improvement in managing pricing and costs of sales. The operating profit margin dropped from 10.4% in 2015 to 7.7% in 2016. This was mainly caused by a significant increase in selling, administrative, and general expenses as a result of an expansion program.
Recently, the company has been expanding into the upmarket segment. This has contributed to a significant increase in operating costs. This ratio is vital because it shows how profitable the core operating segment of a business is. The net profit margin dropped from 8.5% in 2015 to 9.6% in 2016. This signifies an improvement in profitability. The growth can be explained by the significant income that was earned from investments.
The return on capital dropped from 22.53% in 2015 to 19.89% in 2016. This can be explained by the growth in capital employed. The decline can be an indication that the company did not effectively use the available resources to generate profit. Thus, only the gross and net profit margin improved (Figure 4).
A comparison of the profitability ratios for the two companies reveals that JD Sports Fashion PLC had higher values of gross profit margin and return on capital employed. On the other hand, Sports Direct International PLC had higher values of operating and net profit margin. The profitability for Sports Direct International PLC seems to be erratic, while for JD Sports Fashion PLC they are increasing.
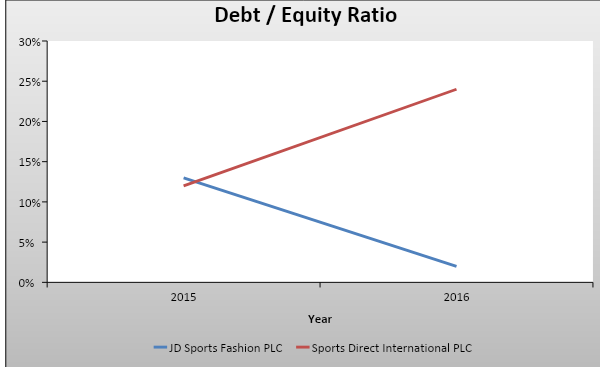
The gearing ratios give information on the proportion of debt and equity that is used by a company. They focus on the capital structure of a company. The ratio is important to investors and debt providers because too much debt can reduce the amount of profit that is attributed to equity providers. In addition, it can affect the solvency of the company. Therefore, a company needs to maintain an optimal balance between the two sources of funding.
The debt to equity ratio for JD Sports Fashion PLC dropped from 13% in 2015 to 2% in 2016. This shows that the amount of debt used by the company decreased. On the other hand, the debt/equity ratio for Sports Direct International PLC had an upward trend (Figure 5). The values rose from 12% in 2015 to 24% 2016. The increase was caused by a £700 million refinancing loan and £915 million that was borrowed for opening up new stores (Sports Direct International PLC 2017).
Thus, it can be observed that Sports Direct International PLC has a higher gearing level than that of JD Sports Fashion PLC. The two companies have a low debt to equity ratios. They still have an opportunity to expand their operations through borrowing.
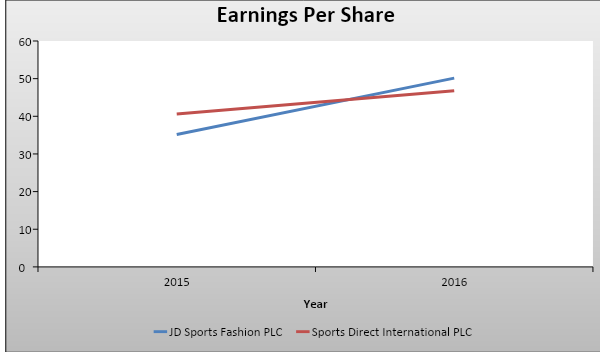
The earnings per share (EPS) for the two companies improved during the two year period (Figure 6). The EPS for JD Sports Fashion PLC rose from 35.17 pence in 2015 to 50.17 pence in 2016. Further, the EPS for Sports Direct International PLC increased from 40.6 pence to 46.8 pence. This ratio gives information on the amount of profit that is assigned to each share. A higher value of the ratio is preferred to lower values because they indicate a higher profitability level.
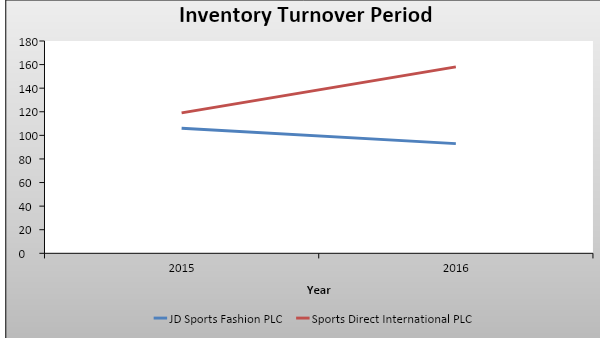
The average inventory turnover period measures the efficiency in handling inventory. That is the rate at which a company restocks. A higher rate is often preferred to a lower one because it signifies an elevated level of efficiency.
Further, some goods, such as perishable commodities, are likely to have a high turnover rate. The average inventory turnover period for JD Sports Fashion PLC dropped from 106 days in 2015 to 93 days in 2016 (Figure 7). Thus, the duration it takes before the company refill stock reduced, signifying an increase in efficiency (Nobes 2014). In the case of Sports Direct International PLC, the value of the ratio grew from 119 days in 2015 to 158 days in 2016 (Table 1).
This shows a reduction in efficiency because the company took a longer period before it replenished stock in 2016. Thus, JD Sports Fashion PLC had a higher efficiency level in stock management than Sports Direct International PLC.
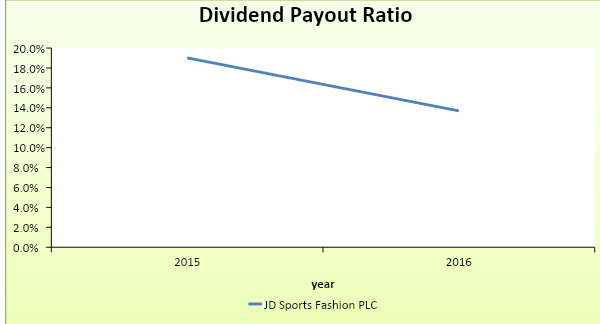
The dividend payout ratios measure the proportion of net earnings that is paid out as a dividend. A low ratio indicates that a company retains a large proportion of net income. The dividend payout ratio for JD Sports Fashion PLC had a declining trend (Figure 8). The values dropped from 19% in 2015 to 13.7% in 2016. This decline can be attributed to the fact that the net earnings increased at a higher rate than the total amount of dividend that was paid. Thus, the proportion of net income that was retained in 2016 grew (JD Sports Fashion PLC 2017). Sports Direct International PLC did not pay out any dividends in 2015 and 2016.
Conclusion
A comparison of the performance of the two companies shows that JD Sports Fashion PLC had a better overall performance than Sports Direct International PLC. The company had growing values of profitability. Further, the gearing level was low. In addition, earnings per share were high and increasing. The efficiency in managing inventory was favourable. Finally, the company paid dividends in 2015 and 2016. The liquidity ratios were low.
However, the company is still able to meet immediate financial obligations. Thus, if this trend persists, the company is expected to perform even better in the future. Sports Direct International PLC had erratic and unpredictable performance. Therefore, based on this financial analysis, an investor should consider buying the shares of JD Sports Fashion PLC.
Recommendations on how to Improve Performance
There are a number of ways the performance of Sports Direct International PLC can be improved. First, the management could come up with effective ways of managing operating costs. This should be done to ensure that adequate profit is generated from operating activities. In addition, the costs of expanding their operations should be managed to ensure that it does not distort the trend of the bottom line. Further, the use of debt to finance operations should be done cautiously so that it does not significantly affect the capital structure and profitability. Finally, the management of the company needs to review its inventory management policies.
This should be done with an aim of ensuring that the inventory turnover is improved. This can be achieved by reducing the reorder quantity. A high inventory balance increases storage costs and wear and tear. Therefore, there is a need for the company to understand its market segment and know the rate at which the stock moves. Thus, reorder levels and quantity should be set to match the speed of stock movement.
The Limitations of Using Financial Ratios
Financial ratios are appropriate tools for analyzing the performance of a company. They allow for comparison of performance from one period to another. They also enable an analyst to compare performance of various companies. Even though ratio analysis is widely used, it has a number of limitations. First, financial ratios only make use of quantitative data. Thus, it ignores the qualitative aspect of performance.
Therefore, it is not comprehensive. The second drawback of this technique is that the operations of various companies often cut across different industries. Therefore, it is difficult to come up with industry average ratios that can be used for analyzing these companies. Another limitation of ratio analysis is that inflation distorts the values that are reported in the financial statements. This limits the ability to effectively compare performance over a period.
For instance, if the inflation rate is 10%, profit can appear to have increased by the same percentage yet this is not an actual increase. Another limitation of this technique is that it ignores the fact that companies use different accounting policies to prepare their financial statements. This makes it impossible to compare the performance. For instance, if a company records net sales while another company uses gross sales, then the sales values of these two companies are not comparable. Another limitation is that if ratio analysis is not done thoroughly, then it may not unearth the possible use of ‘window dressing’ to manipulate the financial results.
A business owner can carry out some transactions at the end of a financial period with an aim of altering the anticipated results. Thus, an in-depth, considered ratio analysis should be carried out to provide any useful insights and information. Finally, interpreting the ratios can be a challenge. For instance, it is not easy to generalize a ratio as either good or bad because various factors need to be put into perspective in any analysis.
Capital Investment Appraisal
Investment Appraisal Techniques
Depreciation expense
Machine 1
- = (£170,000 – £20,000) / 6
- = £25,000
Machine 2
- = £170,000 / 6
- =£28,333
Table 2: Workings for Project A.
Payback period
- = 1 + (80,000 / 90,000)
- = 1 year and 11 months
Accounting rate of return
- = ((25,000 + 35,000 + 45,000 + 75,000 + 85,000 + 65,000) / 6) / 170,000 * 100
- = 55,000 / 170,000 * 100
- = 32.35%
Table 3: Workings for Project B.
Payback period
- = 2 years + 53,333.3 / 73,333.3
- = 2 years and 9 months
Accounting rate of return
- = ((65,000 + 65,000 + 65,000 + 55,000 + 55,000 + 45,000) / 6) / 170,000 * 100
- = 58,333.33 / 170,000 * 100
- = 34.31%
Discussion and Conclusion
The net present value of project A is £120,454.60 (Table 2), while for project B it is £87,500 (Table 3). A project is selected if it has a positive net present value. In this case, the two projects have met the threshold. Therefore, they are both viable. However, project A and B are mutually exclusive. Therefore, the project with the highest value of net present value will be preferred because it promises elevated returns.
In this case, Project A will be selected for investment. Project A has a payback period of 1 year and 11 months, while project B has a payback period of 2 years and 9 months. Based on such criteria, a project with a shorter payback period will be selected because it will ensure that the initial investment is recouped within the quickest amount of time. Therefore, Project A will be considered for investment. Finally, the accounting rate of return for Project A is 32.35%, while for Project B it is 34.31%. Project B will be preferred here because it has a higher value of the accounting rate of return. However, overall, Project A will be selected because it promises higher returns and it has a shorter payback period (Warren, Reeve & Duchac 2013).
The Limitations of Using Investment Appraisal Techniques
The use of various investment appraisal techniques has gained popularity in evaluating the viability of a project. However, the three techniques that are used above have a number of limitations. A major drawback of the payback period criterion is that it does not take into account the effect of the time value of money. Secondly, this specific criterion does not use cash flow that occurs after the payback period. Therefore, the risks of future cash flows are ignored, and there is no concrete decision rule on whether a project can improve the value of a company.
The accounting rate of return also has several of limitations. The first limitation is that it does not take into account the timing of receipts from a project. Thus, it assumes that a project will generate stable profit throughout its entire life. Secondly, the accounting profits are subject to different accounting policies. In addition, accounting profit is often affected by non-cash items such as depreciation. Also, this criterion does not take into account the idea of discounting. Therefore, the concept of time value of money is not used.
Net present value is also considered to be one of the more superior techniques for appraising projects. However, it also has limitations. First, the use of this criterion requires a prior determination of cost of capital. The net present values are quite sensitive to changes in the discount rate. For instance, the use of high discount rates can lead to low or negative values of net present values. Therefore, it is difficult to come up with the most appropriate discount rate. Finally, this criterion does not consider the timing of cash flow (Brigham & Ehrhardt 2016).
References
Brigham, E & Ehrhardt, M 2016, Corporate finance: a focused approach, 6th edn, Cengage Learning, Boston, MA.
Horner, D 2013, Accounting for non-accountants, 9th edn, Kogan Page Limited, Philadelphia, PA.
JD Sports Fashion PLC 2017, 2016 annual reports and accounts. Web.
Nobes, C 2014, Accounting: a very short introduction, Oxford University Press, Oxford.
Sports Direct International PLC 2017, Annual reports and accounts 2016. Web.
Warren, C, Reeve, J & Duchac, J 2013, Financial & managerial accounting, 12th edn, Cengage Learning, Boston, MA.