Coca Cola vs Pepsi: Introduction
The main objective of this report is to analyze and compare two multinational companies, Coca-Cola Company, and PepsiCo. Firstly, this paper will present the historical background of both companies with financial performance and determine the strongest performer. Both companies produce, distribute, and market non-alcoholic beverages worldwide, and Coca-Cola always holds a market-leading position in the Carbonated Soft Drink industry.
This report will scrutinize many other issues related to the business operation of these companies, for instance, mission, vision, corporate culture, strength, weakness, opportunities, threats, growth estimates, organizational structure, marketing mix, competitive position, and ratio analysis. This report will concentrate more on the Coca-Cola Company. However, it will include sections about Pepsi Co to discuss the competitive position of these two beverage companies.
Background of the Coca-Cola Company
Coca-Cola was established in 1886 by John Pemberton. Now it is the world’s largest soft drinks manufacturer, which produces and delivers a broad range of non-alcoholic beverages for all major customer segments and offers different types of drinks. According to the report of Task (2010) and Yahoo Finance (2011), Coca Cola is the top brand among all multinational companies in the world, and its value is $70,452.0 million; however, PepsiCo is not in the top ten lists.
It produces more than 500 non-alcoholic brands in its portfolio and operates in 200 countries for its global sales network. In 2009 its net sales totaled $ 32.14 billion, and its net income was $7.58 billion (Yahoo Finance, 2011). This company serves more than 54 billion beverages of all types consumed in the global market each day; however, the financial overview of Coca Cola for four years has been outlined below to assess its performance in recent years.
Background of PepsiCo
The carbonated soft drink company PepsiCo started its journey in 1893, and the brand Pepsi was developed in 1908. Now, the company generates a revenue of about US$ 60 billion per annum along with its 285,000 employees and enhances global operations (PepsiCo, 2010, p-1).
Yoffie (2002, p.1) pointed out that the US people consume almost fifty-three gallons of beverage each year, and the beverage giants Coca-Cola and Pepsi-Cola have been fighting against each other in an irrevocable war for more than a century while the companies are gaining almost 10% usual market growth both in home and abroad. The following table demonstrates key financial indicators of PepsiCo for years:
Mission and Vision of Coca-Cola
Mission
The main objective of this company is to refresh the world, and the other aims of the company are as follows:

Vision
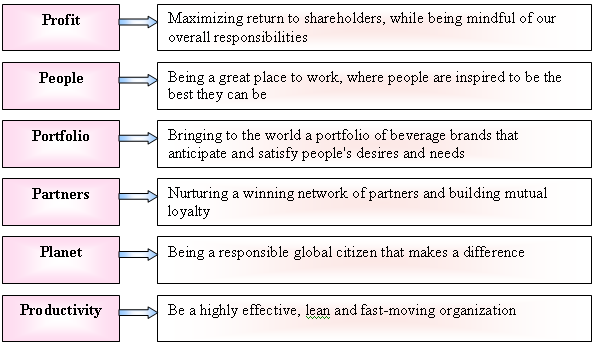
Coca-Cola’s vision is separated into six points, and the company should focus on and accomplish this vision in order to carry on its growth; however, the following figure illustrates its corporate vision:
PEST Analysis of Coca-Cola
Political/Legal Factors
According to the annual report 2009 of Coca-Cola, the legal action against this company has increased due to the frequent change of regulations worldwide. For instance, it has to follow the recommendation and guidance of the European Commission to conduct business in EU member states.
At the same time, political issues can play a vital role in the entire process of Coca-Cola’s business operation by influencing production allocation and retail activities to the final consumers, so the changes in the political environment could change these companies accordingly through both direct and indirect ways. Norden, Koch, and Pronk (2008, p.8) stated that Coca-Cola took legal action against Pepsi in 1938 by arguing that this company had infringed trademark regulation. However, the honorable court held that there was no offense.
On the other hand, some other factors like changes in accounting standards, political violence, state of emergency, taxation policy, alteration of the non-alcoholic business environment, the Federal Trade Commission Act, environmental and labor laws, governmental instabilities in foreign countries, strikes, globalization, and so on affect these two companies.
Economic Factors
Despite the negative GDP growth of the US people, Coca-Cola Company had not suffered any severe hindrances in this market or global market as the impact of the global economic downturn was not excessive to this company. On the other hand, PepsiCo suffered significantly from the recession from its operations in the European market and the rest of the world (PepsiCo, 2009).
The following comparative basic chart demonstrates that the share price of Coca-Cola was always better than Pepsi; however, this share price of both companies faced a sudden slump in 2009.
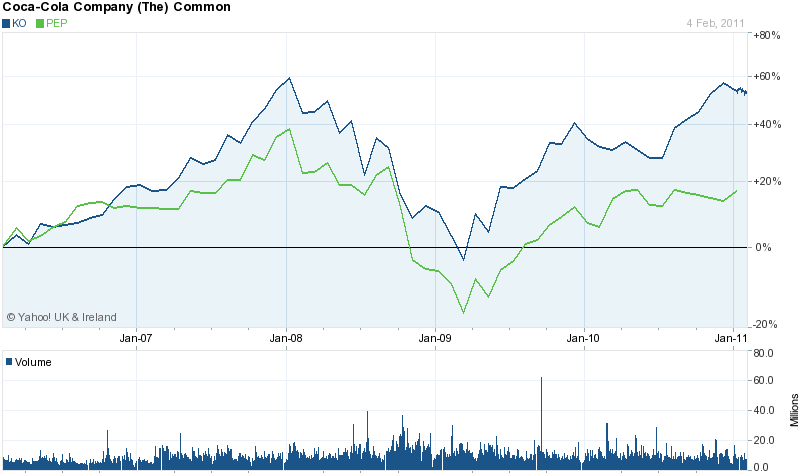
Despite these challenging situations, PepsiCo produced quite a remarkable development in income and started reviving its stock prices in the fiscal year 2011.
Socio-cultural Factors
The following table shows that 20.2% of the total population is children, the large target market of Coca-Cola and Pepsi in the US market.
However, Norden, Koch, and Pronk (2008, p.6) reported that a significant part of the total population is middle-aged people who are health conscious, 7% of the total population has suffered from diabetes, and more than 6.3 million people are not aware of their health problem. It is essential to mention that California banned the sale of soft drinks in order to protect people from obesity and other health problem (Norden et al., 2008, p.6).
Technological Factors
Curd (2010, p.4) pointed out that Coca-Cola has already launched a new lightweight bottle to decrease the quantity of waste plastic, and according to the annual report, it is using technical equipment, for instance, coolers, fountain machinery, and vending tools.
Moreover, Norden, Koch, and Pronk (2008, p.8) stated that Coca-Cola concentrates on developing information technology, so the IT department constantly works to ensure the greatest technological assistance. In addition, it is imperative to note that the company has hi-tech instruments that help to increase production levels with fewer human efforts in the global market; therefore, Coca-Cola successfully reduced the operating cost by reducing 20% employees.
On the other hand, PepsiCo has introduced agricultural technology to guarantee the highest crop yields and quality standards. It has also developed Sustainable Engineering Guidelines and maintained an innovative environmental management system to examine water (PepsiCo, 2009).
Organization Structure of Coca-Cola
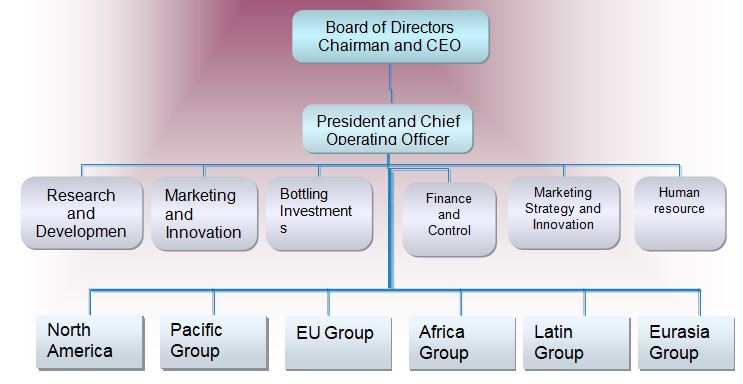
Coca-Cola has maintained the cooperative (M-Form) of the multi-divisional structure as it generates more than 90% of total profits from the beverage sector. However, it is not earning from a single product, but the production material is shared. Nevertheless, the following figure shows the organizational structure of Coca Cola, where the CEO controls six separate departments in different business zone, such as the human resources department, R&D, Bottling Investments, Marketing Strategy and Innovation, and Finance and Control department.
On the other hand, PepsiCo is a highly diversified company, so it has to maintain a complicated organizational chart as it has more than 203,000 employees.
SWOT Analysis of Coca Cola
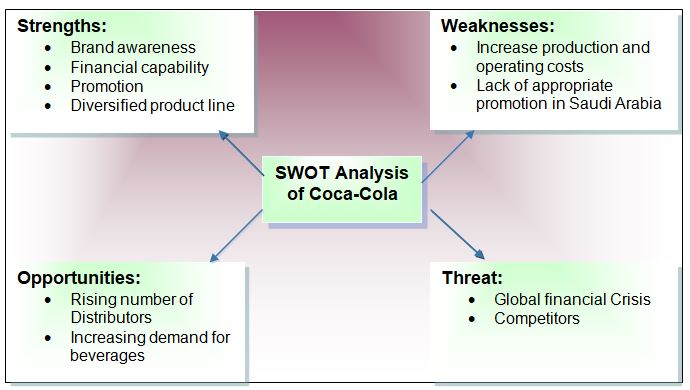
Strengths
Reputation
Coca-Cola has an excellent historical background, brand awareness, and eminent image, which helps the company to increase its profit day by day and to be a market leader among all multinationals. It maintains well-trained employees to produce diversified product ranges from juices to carbonated drinks and has a strong distribution channel (Puravankara, 2007).
Worldwide Operation
Moreover, Coca-Cola has business operations in two hundred countries and has solid financial conditions to expand further in many underdeveloped economies; on the other hand, PepsiCo operates only in forty countries.
Financial Position
According to the 2009 annual report, Coca-Cola is one of the leading global businesses with a sturdy financial position; its profits were $6824.0 million in 2009, while this figure was $5807.0 in 2008.
CRM
Customer relationship management of Coca-Cola is another strong side because this company considers that all customers are loyal, so new customers are also getting importance besides regular customers to develop its market segments. On the other hand, it has popularity for its superior customer service as it concentrates on the customer’s health conditions by providing safe and healthy drinks to retain and attract customers (Coca-Cola, 2009).
Weakness
Cost
According to the annual report 2009 OF Coca-Cola, it spends a large part of its budget on advertisement and promotional actions, increasing its operating expenses.
Health
Curd (2010, p.3) stated that Coca-Cola affects the teeth, and long addiction to soft drinks negatively influences public health. For instance, it may cause to increase in diabetes patients.
Implementation of Strategy
It is arguable that in many cases, Coca-Cola’s marketing activities created immense controversies in the countries where it has operations. Curd (2010, p.3) further added that this company failed to implement sufficient strategies to address the cultural factors, which has a negative impact on its global business operation.
Opportunity
Recover market position
Coca-Cola can gain competitive advantages over the competitors in terms of technological experience by increasing the budget for research and development, which helps the company to diversify its product range. On the other hand, the number of distributors is rising, and the demand for Coca-Cola’s beverages is increasing quickly after recovering economic condition from the financial crisis.
Noncarbonated Drinks
Public interest in noncarbonated drinks is increasing dramatically while Coca-Cola captured a 7% share and PepsiCo holds an 8% market share; as a result, Coca-Cola has unlimited scope to expand its business in this sector.
Pure Water
Puravankara (2007, p.31) pointed out that Coca-Cola can increase sales profit by selling bottled pure water as the demand has increased by 8.5% in this segment due to severe water pollution in some countries.
Threats
The following factors show the threats.
Health consciousness
According to the Coca-Cola annual report, customers, government, and health officials are becoming more anxious about public health issues because the researchers show the negative impact of soft drinks on health. For instance, sugar-sweetened beverages with HFCS are harmful to health.
In addition, water pollution is another problem in maintaining a high quality of the products as water is the most essential ingredient. Hence, Coca-Cola has to invest a considerable amount to get pure water, which raises production costs and affects sales revenue.
Recessionary Impact
Both Coca-Cola and Pepsi experienced the adverse impact of the global economic downturn on their annual revenue. For instance, Coca-Cola has reduced the employees’ pension fund, and PepsiCo’s earning from the European zone has decreased due to the recession.
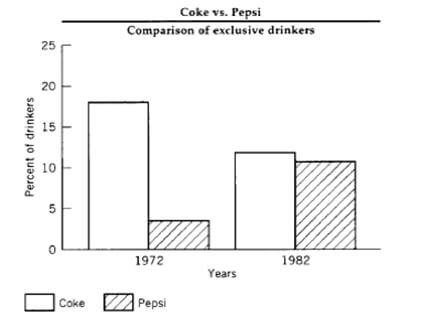
Competitors
An increasing number of competitors is another threat to Coca-Cola because strong competitors can reduce the market. For example, Coca-Cola faced intense competition in the 1980s, and the following figure compares the situation:
Other
Fluctuations in foreign currency exchange rates, increases in income tax and interest rates, changes in regulations relating to beverage containers, and dilemmas with bottling partners.
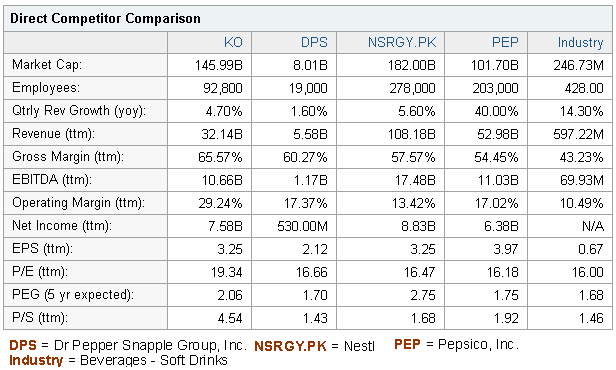
Competitive Analysis of Coca-Cola and Pepsi
In 2010, Coca-Cola’s total sales revenue was 32.14 billion, net income was 7.580 billion, and gross margin was 65.57%. It has about 92,800 employees, whereas its direct competitor Pepsi has about 203,000 employees, and DPS has only 19,000 staff. However, the subsequent picture demonstrates direct competitors of Coca-Cola:
Coca-Cola has a strong presence in the international market; for instance, it has successfully captured a 51% share of the US market, 61% share of the Mexican market, 56% share of the German market, and 51% of the Brazilian market. Then, PepsiCo had a better position only in the Middle East, where Coca Cola created some controversy through its advertisement and lost its market share in this zone.
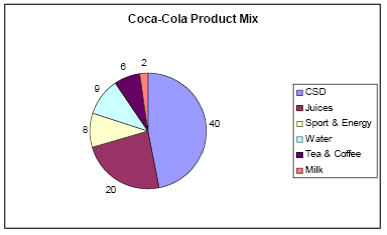
Product
Norden, Koch, and Pronk (2008, p.14) stated that Coca-Cola mainly focused on the beverages sector, and 40% of the products related to carbonated soft drinks, 20% of the products occupied with juices, and the rest of the parts also linked with soft drinks and water.
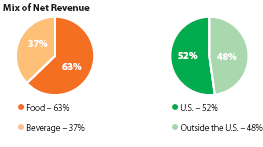
According to PepsiCo’s annual report 2009, about 63% of its profit comes from the food sector, and only 37% of its total revenue generates from the beverage sector. It is important to note that only 48% of its total profit comes from outside the US market, so it should follow a brand expansion strategy to earn more from the international market.
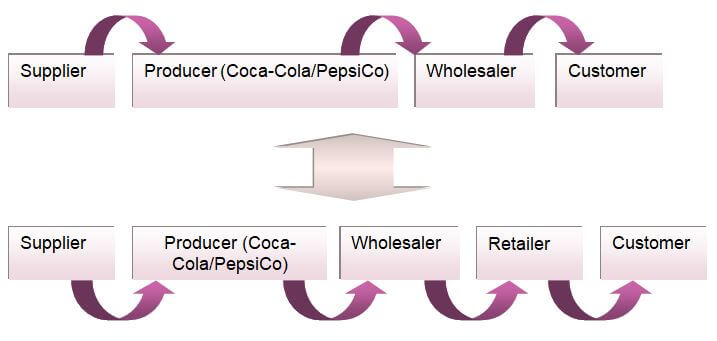
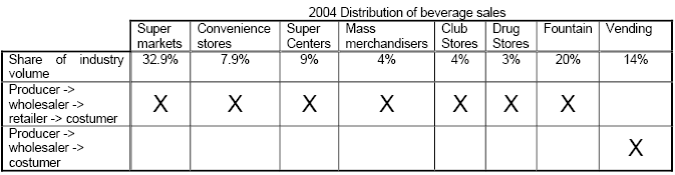
Network
The Coca-Cola Company and PepsiCo possess a rather complicated networking system. As global distributors, both companies went through an intricate process of networking in order to deliver their products to the final consumers. However, a brief illustration of the networking is shown in the figure below:
Recommendations
Both Coca-Cola and Pepsi should develop their corporate social responsibility in order to gain customers’ confidence, as the use of pesticides in the soft drinks demonstrates that these companies do not bother with public health issues but to make a profit with the harmful product, particularly Indian people suffered health injury due to consuming products of Coca-Cola.
According to the annual report 2009 of Coca-Cola and Pepsi, the Global Financial Crisis has reduced their sales to some extent, as people were busy meeting their necessities rather than luxury; as a result, these companies should reduce operating costs to avoid adverse impacts from this situation.
It should note that Coca-Cola has already taken a few fruitful initiatives, which helped the company sustain itself as a market leader, while Pepsi faced a severe problem in the Chinese market and some other countries; so, this company should increase its research budget to overcome such a position.
As the customers’ choices are changing gradually, Coca-Cola should introduce new products considering the market demand of the population by launching delicious drinks with distinct flavors and tastes. In addition, it would be profitable for the company to enter the food market as PepsiCo enjoys a competitive advantage in this sector.
Though a strong brand image is one of the main strengths of Coca-Cola, this company has created some controversial issues. For example, its alignment towards Israeli rather than Arabs reduced its market shares, Nazi affiliation to the genocide of 470 workers in Colombia, and implementation of the governmental policy of the US in case of global operation created hindrances.
As a result, it should try to focus more on compliance with local rules and regulatory barriers in the Middle East and other Asian countries. It should shape its behavioral conduct to increase its market shares.
Coca Cola vs Pepsi: Conclusion
In the changing pace of globalization, the international soft drinks market is going through a massive change in terms of competitiveness in the market. Even in such an antagonistic environment, it is arguable that, in many instances, the Coca-Cola Company was able to uphold its reputation as the most successful beverage seller in the market.
Since the industry faces strong contention from a number of soft drinks producers worldwide, the industry giants like Coca-Cola Company and PepsiCo constantly need to come up with innovative ideas and strategic approaches to remain the most significant choice of large-scale consumers.
Reference List
Bloomberg Businessweek. (2011) COCA-COLA CO/THE (KO: New York). Web.
Bloomberg Businessweek. (2011) PEPSICO INC (PEP:New York). Web.
Coca-Cola. (2009). Annual report 2009 of Coca-Cola Company. Web.
Coca-Cola. (2011). Coca-Cola’s Mission, Vision and Values. Web.
Curd, M. (2010). Marketing Plan: Coca-Cola in 2015. Web.
Indexmundi. (2010) Saudi Arabia Demographics Profile 2010. Web.
Kotler, P. & Keller, K. L. (2006) Marketing management. (12th ed.). New Jersey: Pearson Prentice Hall.
Norden, L. Koch, C. & Pronk, S. (2008). Marketing Management. Web.
PepsiCo. (2009). Annual report 2009 of PepsiCo. Web.
PepsiCo. (2010) Our History. Web.
Puravankara, D. (2007). Strategic Analysis of the Coca-Cola Company. Web.
Task, A. (2010). Top 100 Global Brands: Apple Soars, BP Slumps and Coke’s Still No. 1. Web.
Yahoo Finance. (2011). Competitors of the Coca-Cola Company (KO). Web.
Yahoo Finance. (2011). The Coca-Cola Company (KO). Web.