Coca Cola System: Costs of Production
Costs of production have a crucial effect on the company’s profitability and development. The main types of expenditures Coca-Cola faces include the cost of materials, production, distribution, and promotion. Each of these can alter in time, which inevitably influences the company’s profitability. While costs on transportation and production are generally impacted by the world economic situation, advertisement expenditures are largely governed by the social aspect. Not only does Coca-Cola promote its products as any business but it also has a life-long rival, Pepsi, the ad campaigns against which are probably the most creative and costly (Bloomberg, 2018). At the same time, the firm’s profitability is contingent on the outcomes of such adverts, so it would be impossible not to allocate financial resources for them.
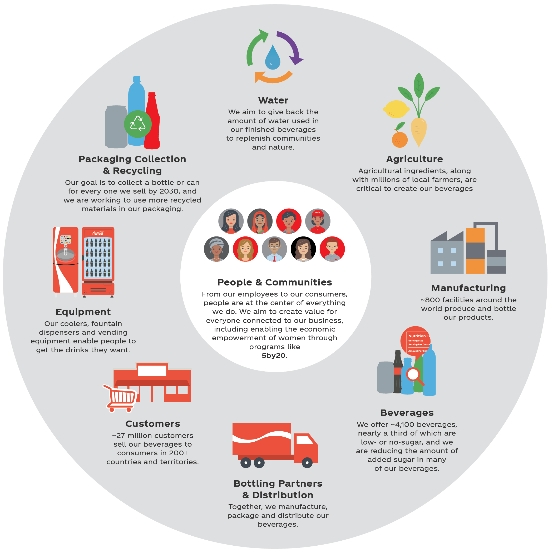
Variable and fixed costs affect the company’s output decisions to a great extent. Variable costs are the ones that can change depending on the output of production. For Coca-Cola, such costs are raw materials, transportation and delivery, and packaging. The main types of raw materials are sugar and corn (Ramakrishnan, 2016). With the increase in production, the amount of materials needed grows, as well. The expenditures on raw materials are highly dependable on weather and climate (Ramakrishnan, 2016). The materials used for bottling the product constitute a large part of cost allocation. Hence, Coca-Cola needs to come up with the most energy-saving and environmentally friendly solutions to bottle its drinks. Finally, transportation and delivery costs depend on the supply chain and fuel prices (Figure 1). Meanwhile, fixed costs include the expenses on bottling plants’ rent, employees’ salaries, advertisements, equipment, and insurance. Out of these, the advertising costs are the least dependent on output since whether it is high or low, the company will not cease promoting its products.
The Analysis of the Overall Market
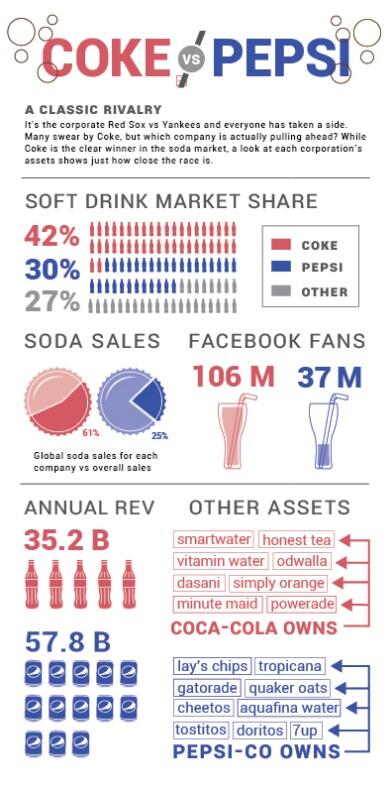
Coca-Cola’s market share is rather high since it is one of the two major leaders in the industry. Nearly 60% of all non-alcoholic beverage production in the world is under the control of Coca-Cola and Pepsi (Maverick, 2018). Coca-Cola has 40% of the market share, and Pepsi possesses 20% (Maverick, 2018). As of 2018, the annual revenue of Pepsi was higher due to the assets the company possesses outside of the soft drinks market (Figure 2).
The barriers to entry into the market are rather high. First of all, they include the wide popularity of Coca-Cola and its biggest rival, Pepsi. The popularity of these companies is so high that many customers remain loyal for generations. However, there is an opportunity for new entrants due to the general tendency of consuming harmful products less and turning to healthier alternatives more. Hence, there is a market niche for new soft drinks producers that emphasize sugar-free beverages. Yet, new actors might need to spend much time, effort, and money on advertising their product to enter the market successfully.
The market structure for Coca-Cola is an oligopoly, which is similar to a monopoly in power but involves more than one influential actor. In the present case, Coca-Cola and Pepsi constitute the oligopoly market of soft drinks. On the one hand, this means that Coca-Cola can control the market to a great extent. However, since it is not a monopoly, the company cannot have full domination over the market.
Recommendation
In terms of cost production in the market, Coca-Cola may see a revenue increase through innovation, improved customer relationships, and optimized low-demand periods. Innovation can be interpreted as the introduction of new ideas or creative patterns of thinking in the industry (“The Coca-Cola Company reports,” 2018). Also, it can be perceived as the application of better technological solutions to fulfill unarticulated requirements in the market. In the case of Coca-Cola, the company could implement an innovative strategy aimed at sales growth and better customer relations through the improvement or replacement of certain business processes to raise organizational productivity and efficiency. Another benefit for the business would be the extension of its existing line of product quality by enhancing the total value-added. Through innovation, Coca-Cola will be in full capacity to adapt to market shifts and react effectively to the unforeseen changes in the industry.
Taking into consideration Coca-Cola’s current position about its competitors in the oligopoly market, one of the ways to implement the innovative strategy would be the application of the basic marketing strategy. In other words, the objective will be accomplished through consumer loyalty programs and brand-building promotion to an unsegmented group of customers (Palmer, 2019). Being at the top of the soft drink pyramid, Coca-Cola can also use the practice of market penetration to appeal to consumers’ taste preferences through offering more unsegmented products to a wider demographic (“The Coca-Cola Company,” 2018). Based on the derived demand trends and price elasticity, the company should consider utilizing a multitude of resources to manufacture and distribute its goods while responding to market trends. The reasoning behind such a statement lies in the belief that the optimization of resources and innovation will allow minimizing the expenditure cost and preventing the surplus when the demand for the products goes down.
References
Bloomberg. (2018). Coke vs. Pepsi: The biggest soda rivalry in history is in full swing again. Web.
The Coca-Cola Company. (2018). Interactive. Coca-Cola system and value chain. Web.
The Coca-Cola Company reports strong operating results for the fourth quarter and full-year 2017; Achieves or exceeds the company’s full year guidance. (2018). Web.
Coke vs. Pepsi infographic. (n.d.). Web.
Maverick, J. B. (2018). Coca Cola and Pepsi control the global beverage industry. Web.
Palmer, B. (2019). Why do companies merge with or acquire other companies? Web.
Ramakrishnan, S. (2016). Cost cuts, cheaper commodities help Coca-Cola top profit estimates. Web.