Tracking down the progress of an organization is an essential part of the analysis that helps locate the problems and obstacles that a firm may face (Majumdar, Das, & Alagirusamy, 2012). Therefore, the application of control charts as one of the most efficient tools for the analysis of the company’s performance is crucial for the environment of the global economy.
By designing a chart that displays the number of defected items produced by an organization one is likely to identify the problems in the production process and, therefore, improve the firm’s performance impressively.
A control chart is typically defined as a “tool for studying variation in data, distinguishing between common cause and special cause variation” (Salvendy, 2007, p. 1821). In other words, the chart in question helps locate the variation in specific data. For instance, the given tool can be used for locating the quality issues in the company’s operations. For instance, the tool under analysis can be used for displaying the correlation between the number of items that follow the current quality requirements and the faulty ones can be displayed.
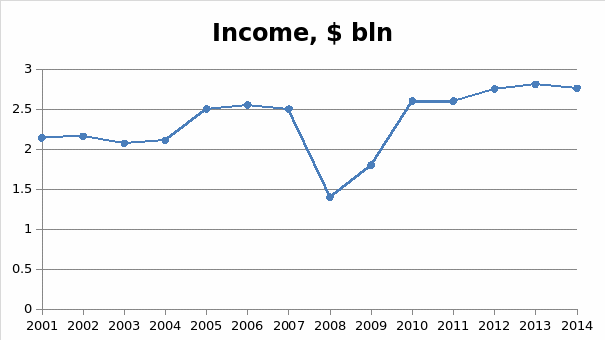
More importantly, the ratio of the two factors mentioned above can be traced on specific time slots with the help of a control chart. In the example below, the correlation between the items that comply with the existing quality standards and the faulty ones is displayed; as the chart shows in a very graphic manner, the company has been facing a rapid and a rather sharp decline in quality of its production since 2013. Therefore, the chart allows identifying a significant change occurring to the firm in 2013, leading to the assumption that the specified change has caused a drop in the quality of the production.
After the location of the point, at which the quality of the production dropped, one may figure out what external and internal factors have caused the specified change. Particularly, the example provided above allows suggesting that the crisis of 2008 was the key external cause of the product quality decline. As far as the internal issues are concerned, the firm may have started developing increasingly big problems with the choice of a financial strategy and the risk management approach. Indeed, the financial crisis that occurred at the time did not allow for a cohesive and reliable financial strategy, nor did it predispose the environment, in which risks could be controlled.

A control chart as a tool, thus, can be considered a very useful means of controlling the company’s performance as well as identifying the low points of its development. Moreover, a control chart displays the pattern of entrepreneurship’s evolution. Consequently, by taking a closer look at a control chart, one may predict the next drop in the firm’s performance and, therefore, prevent it. Although the chart cannot be viewed as the ultimate tool for predicting the company’s further performance, it still helps identify the points at which the firm may have to fight major obstacles.
Although providing rather basic numerical information concerning the rates of defected items produced by the organization, control charts create premises for carrying out a detailed analysis and locating the problems that entrepreneurship may be facing. As a result, a major crisis and a drop in customer loyalty rates can be prevented with the help of control charts. Once introduced into the organization’s production design, they will provide a solid foundation for both detailed statistical reports and economic forecasts.
Reference List
Majumdar, A., Das, A., & Alagirusamy, R. (2012). Process control in textile manufacturing. Amsterdam: Elsevier.
Salvendy, G. (2007). Handbook of industrial engineering: Technology and operations management. New York City, New York: John Wiley & Sons.