Introduction
Turkey, as it stands today, was founded in 1923 from the remnants of Anatolia after the downfall of the Ottoman Empire. Mustafa Kemal under whom the country went through a series of legal, judicial, social, and political and economic changes led the country. The country faced military coups in 1960, 1971, and 1980. The country ahs underwent series of political turmoil and in 2005 it became a member of European Union.
Geography Background of Turkey
Location
Turkey is located in southeastern Europe and Southwestern Asia (CIA 2010). The country is bordered by Black sea in the east, Bulgaria and Georgia, and on the southern side are the Mediterranean Sea and Aegean Sea. The country lies between Syria and Greece. The country’s location is vital for foreign trade due to its proximity to two continents and it’s being connected by three water bodies.
Area
The total area of land in the country is 770,760 sq. km, which is equivalent to 297. 592 sq. miles (CountryWatch 2010). It is the 37th largest country by area, land area being 769,632 sq km and water is 13,930 sq km (CIA 2010).
Area comparative
Turkey is slightly bigger than Texas (CIA 2010).
Land boundaries
The landlocked area of the country comprises 2,648 km of international land border (CIA 2010). The countries with which Turkey shares its international borders are Armenia, Azerbaijan, Bulgaria, Georgia, Greece, Iran, Iraq, and Syria.
Coast Line
The coastal boundary of the country runs for 7,200 km (CIA 2010). The seas, which are attached to the territory of the country, are Aegean, Mediterranean, and Black Sea.
Climate
Turkey has a temperate climate. The summers are hot and dry and the winters are mild and wet. However, climate is harsher in the interiors areas, away from sea.
Terrain
The geographical terrain of the country comprises a high central plateau, which forms the part of Anatolia. Rest is narrow coastal plain. The country has many mountain ranges. The highest peak is Mount Ararat at 5166 m (CIA 2010). A small part of the country’s landfalls in Europe, which is called Thrace (Aliprandini 2009).
Natural Resources
The natural resources available in Turkey are Copper, chromite, bauxite, iron, and manganese (Aliprandini 2009). However, these metals do not provide substantial economic drive. Fossil deposits like petroleum and natural gas are also available. Coal, mostly lignite, is abundantly available in Turkey. However, none of the natural mineral resources is sufficient to meet domestic demand.
Natural Hazards
Turkey is susceptible to natural hazards like earthquakes as it lies in an active seismic belt, especially in the northern part of the country (CIA 2010). Earthquakes may range from minor tremors to devastatingly large scales. The worst recent catastrophe occurred in 1999 when 15000 people died (Aliprandini 2009). Other problems ms include air pollution and deforestation (CountryWatch 2010). The country’s greenhouse gas emission (Mtc) amounts to 97.1 and it ranks 22nd in transmission rate (CountryWatch 2010).
Environment—Current Issues
One of the most recent issues in Turkey related to environment is the problem of water pollution. High tourism in turkey has led to a negative impact on the country’s ecosystem (Aliprandini 2009).
People
Population
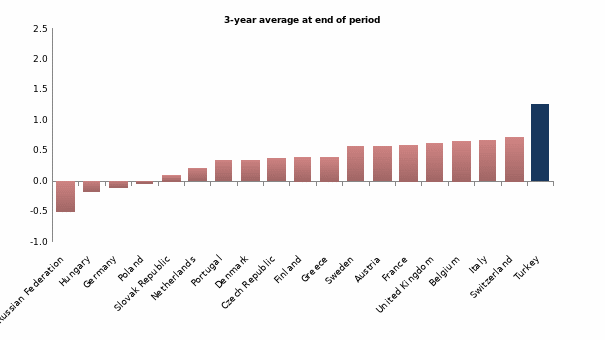
Turkey’s total population amounts to 76 million (CountryWatch 2010). It is the 17th largest populated country in the world (CIA 2010). The country is facing a population growth rate of 1.312 percent, which is 100th highest in the world (CIA 2010). Figure 1 shows that Turkey has the highest population growth rate among the European countries (OECD 2010).
Age Structure
More than 66 percent of the population is in the age group of 15 to 64 years, 27 percent are below 14 years and only 6 percent if above 65 years (CIA 2010).
Median Age: total
According to 2009 estimates, the median age of the country is 27.7 years, for men it is 27.4 years and for women, 28.1 years (CIA 2010).
Birthrate and Death Rate
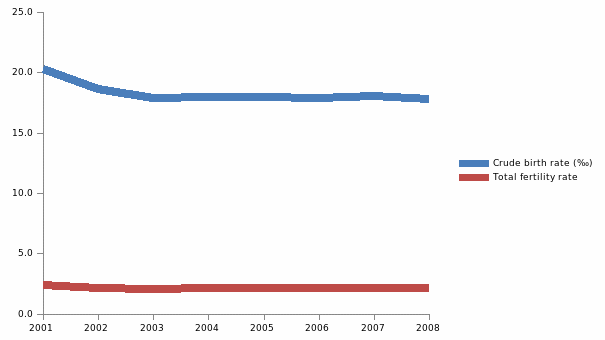
The birth rate of the country is 18.99 out of every 1000 population, which is 109th highest in the world (CIA 2010). The death rate is 6.1 deaths per 1000 population in 2009 (CIA 2010). Figure 1 shows that the birth rate of the country over the period of 2001 to 2008 has been falling.
Sex Ratio
The sex ratio of the country is 1.02, and at birth, it is 1.05 (CIA 2010).
Infant Mortality rate
The total infant mortality rate is 25.78 deaths per 1000 live births (CIA 2010). It is the 84th largest infant mortality rate in the world. For male infants, the rate is 26.84 deaths per 1000 live births, and for females, it is 24.67 deaths per 1000 live births (CIA 2010).
Life expectancy at birth
The life expectance for the total population is 71.96 years (CIA 2010). For males, the life expectancy is 70.12 years and for females, it is 73.89 years.
Total fertility rate
There are 2.29 children born per woman in the country according to the estimates taken in 2009 (CIA 2010). Fertility rate of the country has been stable from 2001 through 2008 (see figure 1).
HIV/AIDS, people living with HIV/AIDS
There are less than 0.1 adults living with HIV/AIDS in the country.
Nationality
Approximately 80 percent of the population is ethnic Turks.
Ethnic groups and percentages
There are Turks of Kurdish origins that form 20 percent of the population (CountryWatch 2010). Other minorities comprise 10 percent of the population (CIA 2010).
Religions and percentages
The majority of the population (99.8 percent) is Muslims (CIA 2010). Among them most of the population is Sunni Muslims. Turkey is also the home of Alwai Muslims (CountryWatch 2010). Other 0.2 percent is Christian and Jewish.
Literacy
87.4 percent of the population is literate in Turkey. More male population (95.3 percent) is literate than female population (79.6 percent) (CIA 2010).
Government
Government type
The Turkish government is a constitutional republic with a mixed parliamentary system (CountryWatch 2010).
Capital
The name of the capital is Ankara.
Independence
The country became independent on 29 October 1923 (CIA 2010).
National holiday
The country observes national holiday on 29 October as Republic Day.
Constitution
The constitution of the country was framed on 7 November 1982 (CIA 2010). It was amended later in 1987, 1995, 2001, and 2007.
Legal system
The legal system is derived from different constitutional legal systems of Europe (CIA 2010, CountryWatch 2010). The country observes ICJ regulation with certain reservations (CIA 2010, CountryWatch 2010).
Suffrage
The country follows “universal suffrage” after the age of 18 years (CIA 2010).
Executive branch
The executive branch comprises the President, Prime Minister, and the cabinet of ministers (CIA 2010). The head of the state is President Abdullah Gul since 2007 (CIA 2010). The head of the government is Recep Tayyip Erdogan since 2003. The elections are held every five years. The last general elections were held in 2007. In October 2007 however, a constitutional amendment was done which allowed direct presidential elections.
Legislative branch
The legislative body is called the unicameral Grand National Assembly of Turkey or Turkiye Buyuk Millet Meclisi (CIA 2010). The house consists of 550 seats, and members are elected through general elections.
Judicial branch
The judicial branch consists of the Constitutional court, High court of Appeals called Yargitay, Council of States called Sayistay, Military High Court of Appeals, and the Military High Administrative Court (CIA 2010).
Flag description
The Turkish flag is red in color with a vertical white crescent, with its closed portions towards the hoist side (CIA 2010). The flag also has a white five-pointed star on the open side of the crescent. The flag resembles the banner of the Ottoman Empire.
Overview of economy
The Turkish economy is a mixture of modern industry and traditional agriculture. Agricultural sector accounts for 30 percent of the total employment of the country (CountryWatch 2010). The GDP of the country in 2007 was $960.3 billion (OECD 2010). The real growth in GDP shown in figure 3 demonstrates that since 2004, the Turkish economy has been facing a downward trend. In the 1990s, there has been a series of vicissitudes in the economic growth, which is attributable to a series of “economic mismanagement” (CountryWatch 2010, 71). There are cyclical movements of the real GDP growth rate. The present fall in the growth rate may be attributable to the advent of the global economic crisis due to crash of the financial market. The reason for the low growth rate in the decade of 1990s was higher rate of inflation and trade deficit. By 2000, the economy slightly recovered. However, by late 2000, due to a deficit in the current account deficit, failure to implement structural reforms, and a weak banking system, the Turkish economic growth again started to fall. In 2001, there was an internal problem regarding the home currency lira, and consequently the bank rate was increased considerably. During this period the exchange rate was also low and it was allowed to float in 2001 (CountryWatch 2010). This pushed inflation as the exchange rate was floated at more than half its value. This increased the government debt ratio by 90 percent.
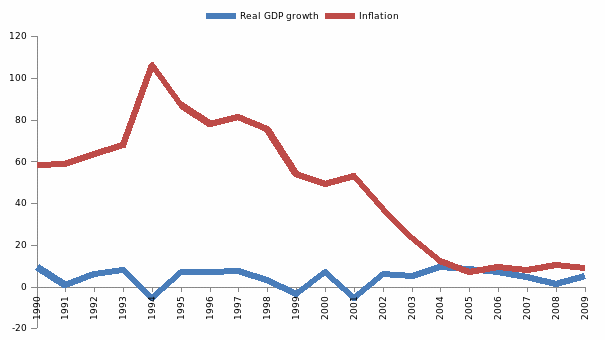
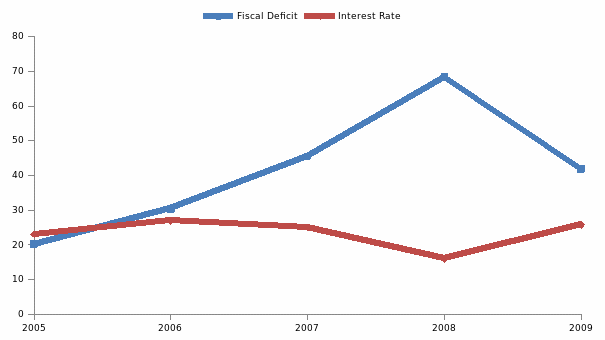
The economic condition of the country declined sharply in 2001 with a native growth rate of 9.5 percent (OECD 2010, CountryWatch 2010). However, the real GDP growth rate averaged above 7 percent from 2007 through 2007. This growth rate was driven by increase in private consumption and productivity (CountryWatch 2010). In the 2008, due to the global economic crisis, there was a sharp fall in the real GDP to 1.1 percent and a negative growth rate of 5.1 percent in 2009 (CountryWatch 2010). The increase in inflation indicated the rise in the prices of essential commodities globally.
Population below poverty line
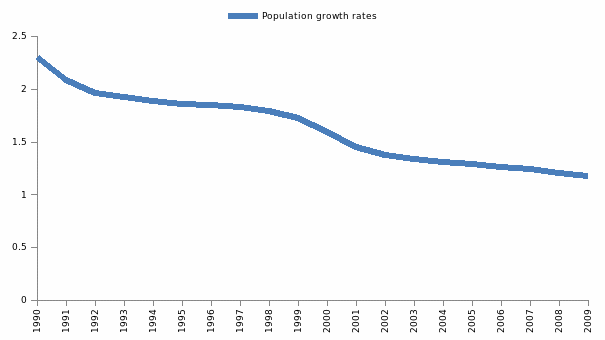
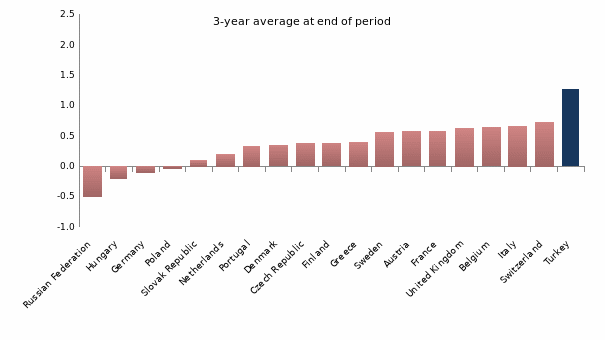
Figure 4 shows the population growth rate of the country has been falling constantly. A comparison of the population growth rate of the other European countries shows that turkey has the highest rate of average end period real GDP growth rate in 2007 (see figure 5). Though the country’s population growth has been declining, it is higher than in many other European countries.
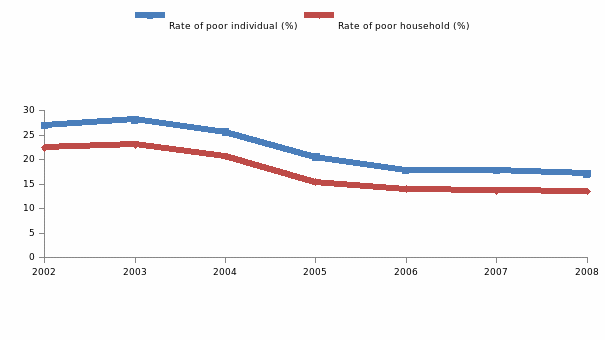
In terms of poverty rate, there has been a distinct decline in the measure. Figure 6 demonstrates a declining graph for both individuals as well as household poverty rate and it has fallen from 2002 until 2005, and then it has gradually become stable.
Labor force
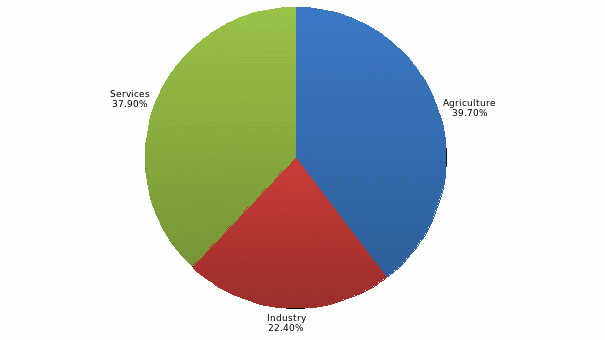
The country has a labor force of 23.79 million people (CountryWatch 2010). Figure 8 shows that the sectoral division of labor.
Labor force by occupation
The figure shows that the largest portion of the labor force of the country is still engaged in agricultural production (39.7 percent), industry has 22.4 percent and 37.9 percent are in services sector (CountryWatch 2010).
Unemployment rate
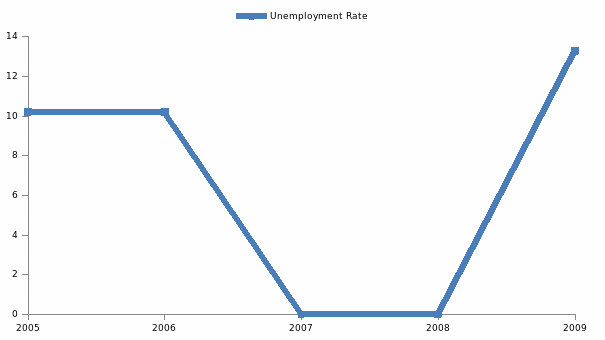
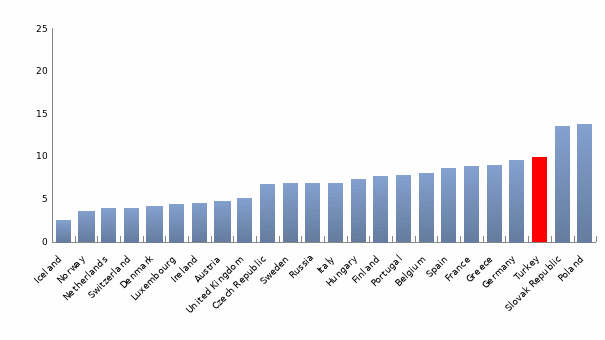
Unemployment rate in Turkey has been going through intermittent rise and fall (see figure 9). The unemployment rate was at 10.2 percent in 2005, it remained constant through 2006, and in 2007, it fell to zero and remained at zero even in 2008. Then again, the unemployment rate rose to 2009. Further, a comparison of the average unemployment rate for the period 2005 to 2007 among European countries is shown in figure 10. The comparison shows that Turkey has the highest unemployment rate after Slovak Republic and Poland.
Budget
According to CIA data, Turkey government’s budget revenue in 2009 was $145 billion and expenditure was $180.6 billion. Table 1 shows the estimates of government spending for has been increasing at a fast rate, with only in 2009 that it showed a negative growth of 15 percent.
Table 1:
Agriculture products
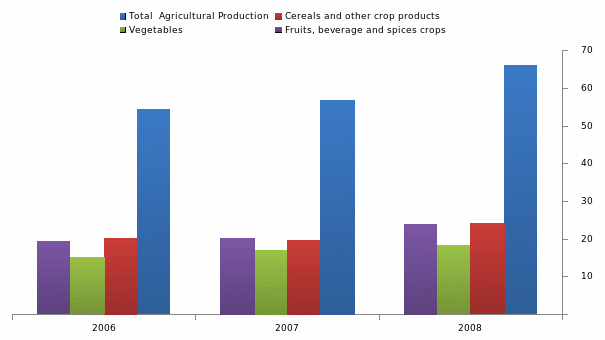
The main agricultural products of the country are cereal, fruits, and vegetables (see figure 11). Total agricultural production has been rising in turkey over the year 2006 to 2008. Similarly, there has been a rise in the production of cereals, vegetables, and fruits.
Industries
The main industrial products of Turkey are “textiles, food processing, autos, electronics, mining (coal, chromate, copper, boron), steel, petroleum, construction, lumber, paper” (CIA 2010). The industrial production took a dip in 2009 by 11.8 percent. The largest industrial sectors of Turkey are textiles and clothing (CountryWatch 2010). This industry accounts for 1/3rd of the industrial employment of the country. However, international competition is high in the sector. Other prominent sectors of the industrial sector of Turkey are automobiles and electronics (CountryWatch 2010).
Export Partners
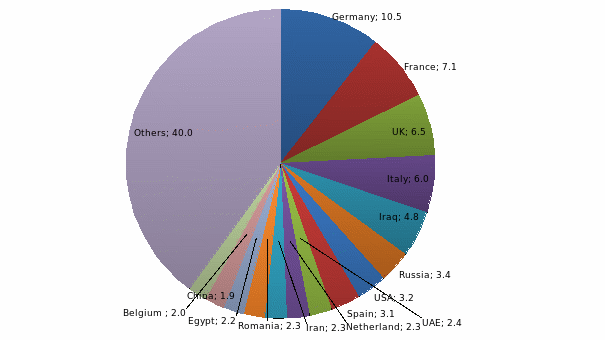
Further turkey is a member of the Organization for Economic Cooperation and Development (OECD), World Trade Organization (WTO), International Bank for Reconstruction and Development (IBRD), and International Monetary Fund (IMF). The main export partners of the country are Germany, France, UK, Italy, and Iraq. The largest trade partner of the country is Germany France, UK, Italy and Iraq. Figure 12 shows the main export partners of Turkey and their share in export for 2008.
Import Partners
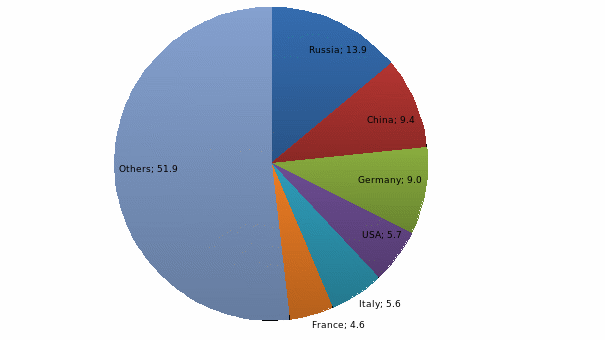
Figure 13 shows the import partners of Turkey for year 2008. The study demonstrates that the largest partner is Russia, then China, Germany, USA, Italy, and France.
Debt-external
Turkey has an external debt of $274 billion and it has a debt of $278.1 billion in 2008. Thus, there is a slight fall in the external debt.
Economic aid recipient
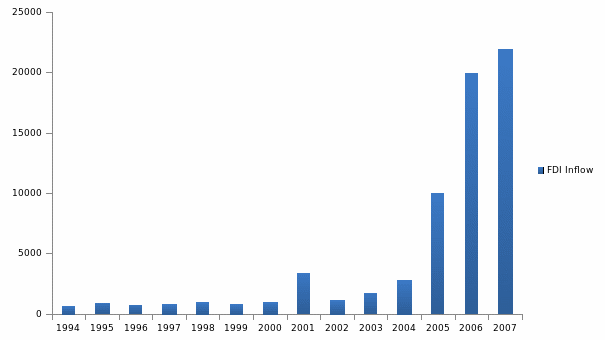
Turkey has received foreign aid from the US in two forms – loans measuring more than $12.5 billion and financial aid for military assistance above $14 billion (Bureau of European and Eurasian Affairs 2010). Apart from this, there has been an increase even in form of foreign direct investment (FDI) inflow since 2000. Figure 14 shows an increasing trend of FDI inflow, which peaked in 2006 and 2007.
Exchange Rates
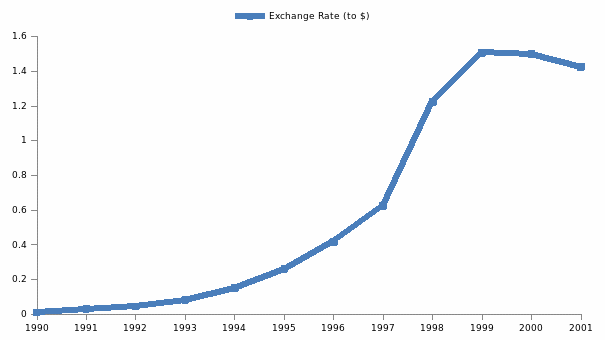
The exchange rate of turkey is found to be highly volatile. The lira had become weaker over the period of 1990 through 2007 due to weaker productivity and declining real growth rate. According to CIA, data Turkish lira per US dollar is 1.554 in 2009 (CIA 2010).
Communications
Telephone System
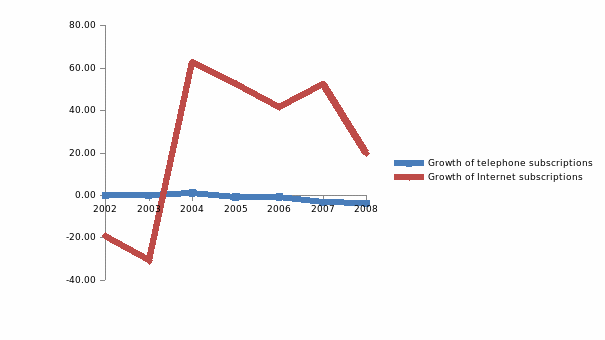
The country has 17.502 million telephone lines in use, and is ranked 18th in telephone main lines in use. The country ranks 15th in mobile cellular usage, which amounted to 65.824 million in 2008 (CIA 2010). The telephone system is comprehensive with a rapid modernization drive in the sector. The figure shows that there has been a gradual and sustained growth in the increase in telephone subscriptions in the country.
Radio Stations
There were 1090 radio stations in 2009 in Turkey.
TV Stations
There are 251 TV broadcasting stations.
Internet country code
The internet country code is.tr.
Internet users
There are 24.483 million internet users in the country, which is 15th, largest in the world. Initially there was s drop in internet subscriptions in 2002; however, there was a rise in 2003. Since then there has been a gradual downfall in the number of internet subscriptions in the country (see figure 2).
Transportation
Turkey has 102 airports in 2009, and ranks 59th in world rankings. 90 airports are paved with runways, and 12 have unpaved runways (CIA 2010). There are 21 heliports. The total railway line in Turkey is 8697 km and roadway consists of 426,951 km. the ports of the country are “Aliaga, Diliskelesi, Izmir, Kocaeli (Izmit), Mercin Limani, Nemrut Limani” (CIA 2010).
Military
The total military power of Turkey is 514,850. The country spends $12.155 billion as military expenditure, which forms 5.3 percent of the country’s GDP (CountryWatch 2010).
Military branches
The military branches comprise of two branches – the land forces called the Turkish Armed Forces (TSK), and Air Force called Naval Forces (including Naval Air and Naval Infantry) (CountryWatch 2010).
Military manpower (military age)
The age when citizens are eligible to enter service is 20 years. Entering into military service is not mandatory.
Military manpower (availability)
There are a total of amount of people fit for military service is 13905901 male and 133335812 female (CountryWatch 2010).
Conclusion
Turkey’s geographic location gives it the advantage of being closely connected to two continents i.e. Asia and Europe. Further, Turkey’s connectivity to three seas helps in trade. The political condition in Turkey has adversely affected the economy, due to changes in regime, mismanagement of economy and financial conditions. Further bad monetary and fiscal policy along with wrong policy imperatives have led to the downfall of real GDP growth in the country. Further, the government’s lack of initiative to allow foreign investment in the country had led to low FDI investment in the 1990s. However, the situation has changed. The socio-ideological difference in the country’s political factions has affected foreign trade (BMI 2010). Further, a high degree of a budget deficit of 6.2 percent of GDP will lead to further economic risks in the country (BMI 2010). Therefore, the country’s economic prospect in terms of investment is risky.
Reference
Aliprandini, Michael. “Turkey.” Our World: Turkey (2009) : 1-6.
BMI. Budget Shortfalls Continuing. Economic Risk, Emerging Europe Monitor, 2010.
BMI. Expect More Political Crises. Political Overview, Middle East Monitor, 2010.
Bureau of European and Eurasian Affairs. “Background Note: Turkey.” US Department of State. 2010. Web.
CIA. The World Factbook. 2010. Web.
CountryWatch. Turkey Review. Country Report, New York: CountryWatch Incorporated, 2010.
OECD. Stat Extracts. 2010. Web.
Turkish Statistical Institute. 2010. Web.