Introduction
Carbon Nanotubes (otherwise known as CNTs) are distinctive nanostructures which have very notable mechanical and electronic properties and which in recent days of sciences have been marvelously accepted as been of immerse benefit to technology and sciences throughout the world. Presently, the most assured technique for the production of Carbon Nano-tubes (CNTs) is Catalytic Chemical Vapour Deposition (CCVD) and it accounts to low-cost and specified material production. This technique constitutes carbon-decomposition which has gas in support of a catalyst. Compared with the numerous kinds of sources of carbon which are made use of for the development of Carbon nano-tubes, their fusion is limited to the reaction of thermal decomposition of carbon-source employed. Growth-parameter-optimization remains very empirical in nano-analysis which concerns techniques utilized in the determination of the structure(s) of atoms in materials- a technology that resembles the one utilized in microanalysis. The exception to the similarity is that it is carried out with the use of a nanometeric scale.
There is usually a frontier point with the usage of any instrument for nano-analysis (the least object-diameter is resolvable). The reality of the fact is mostly accrued with instruments which use electro-magnetic radiations like IR, UV, X-rays, or visible light as well as when such instruments employ the usage of high-speed sub-atomic bits like ions and electrons.
This paper is concerned with nano-tubes and suspension as well as stabilization which make use of Mult-Wall-Carbon-Nanotubes (MWCNT) by function of concentrated SDS. The stabilization of the suspension is attained temperature-dependent using 1ml to 5ml SDS and 1ml to 10ml DTAB. Several experiments were carried out for the benefit of authenticity of result and data from the experiments is tabled below.
Analytical Data
On the 16th of August, 2010, data in table 1 was obtained as first data from experiment 1 and values are presented in table 1 below:
Table 1: First data.
A second experiment was conducted on the 3rd of September, 2010 and data was generated for the confirmation of the authenticity of the first data which was obtained in the first experiment on the 16th of August, 2010 and values are shown in table two below:
Table 2: Second data.
The data obtained in table 2 however shows sharp contrast from that in table 1 as shown in table 3. Table 3 is produce using equation from plotted Absorbance against time (min) at 850nm (Using exponential trend) at 5ml of SDS, 1ml, 2ml, 5ml and 10ml of DTAB. It is pertinent to note that the results from table 1 and table 2 emerged from experiments conducted within a space of at least 432 hours from 16th of August, 2010 to 3rd of September, 2010. As such, there could be environmental variations such as temperature changes which according to Hongjie (2002) could accounting for the data discrepancy; where data 1 lacks stability while data 2 is quiet stabilized. However, in a
Table 3: Result of equation from plotted Absorbance against time (min) at 850nm.
similar experiment to study the stability of MWNTs in a Natural Organic environment, similar contrasting result was recorded by Yawun (2008) who stated that:
‘MWNTs were readily dispersed as an aqueous suspension in both model NOM (Suwannee River NOM (SR-NOM)) solutions and natural surface water (actual Suwannee River water with unaltered NOM background), which remained stable for over 1 month’ (Yawun, 2008).
Analyses using a microscope offered a suggestion that the primary constituent of the suspension were independently dispersed MWNTs. MWNTs’ suspended concentration in the liquid phase was quantified with the use of Thermal Optical Transmittance Analysis (TOT) within the range of 0.6 and 6.9 mg/L; which were the initial SR-NOM and MWNT concentrations. MWNT stability in case of the experiment was compared to that from water which was taken from River Suwannee and a one percent SDS discrepancy was recorded.
The result indicates dispersion of nanomaterials which are carbon-based in nature. Thus variation of the result from table 1 and that of table 2 may be accredited to a mechanism of environmental fate, since the experiments were to some limit not conducted under extreme regulated environmental conditions.
However, a third experiment was conducted and results are shown in table 4 for flexibility of choice on which of the previous data to adopt. It is worth of note that the time variance of the third experiment and the second in days is not as widen as that from experiment 1 and 2. As such, the variation in environmental changes such as temperature may be considered to be negligible or constant. It is likely then that data 2 and data 3 would relate in terms of stability.
Table 4: Third data.
From first data, second data, and third data, table 5 is generated using exponential trend.
Table 5: Graphical values using exponential trend.
The result from table 6 is plotted as Absorbance against time (min) using exponential trend.
Table 6: Graphical values.
The following values in table 7 from Ln Absorbance against time(min) using linear trend were generated:
Table 7:Ln Absorbance against time(min) using linear trend.
Discussion of results
This analytic study examines the aqueous stabilization of Multi-walled-carbon-nanotubes (MWNTs) in the availability of a concentrated solution of Sodium Dodecyl-sulfate (SDS). Multi-walled carbon nanotubes (MWNTs) were easily dispersed in the several model solutions of Sodium Dodecyl-sulfate in aqueous suspended form and at the end of the experiment; this was noted to attain stability. Dresselhaus et al (2001) in similar analysis using a microscope opined that the primary constituent of the suspension independently dispersed MWNTs. Multi-walled carbon nanatubes in a concentrated aqueous state suspension was quantified with the use of 1ml to 5ml SDS and 1ml to 10ml DTAB. It was also found by Kong et al (2010) that river water from Suwannee expressed a likened capacity of stabilization when it was contrasted with SR-NOM solution model. With the concentration of MWNT used initially, the suspended MWNT’s concentration in SDS solution and for the commencing concentration of MWNT suspension which is in SDS solution and DTAB were considered to be of a greater value than a percentage of Sodium Dodecyl Sulfate (SDS), which is a surfactant greatly used in the stabilization of aqueous phased CNTs.
The findings suppose a fact that carbon-related nano-materials disperse naturally, even though the aqueous environment could exist with a mechanism that may not be expected.
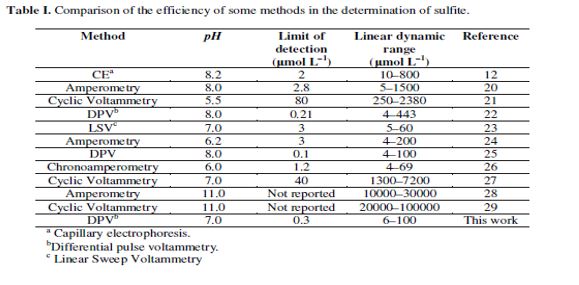
Typically, sulfite belongs to the group sulfur oxoanions, and determining it is of high significance when considering a number of situations with regard to the environment and industries. This is so especially when observations are taken of the atmosphere (Satishkumar et al., 1998) and when observing beverages and food products (McEuen, 2000). It is also of high value in the treatment of wastewater which is gotten from paper-mills and in procession of liquors (Dekker, 1999) as well as in sites for extraction and mining (Nikolaev et al., 1999) and in laboratories for processing materials on photography (Journet et al., 1997).
Numerous techniques have been suggested for usage in determining sulfite; among them are Capillary Electrophoresis method (Journet et al., 1997), Titration method, Spectrophotometry method, High-performance Liquid Chromatography method, Chemiluminescence method, Electrochemical (Liang et al., 2000), and Flow Injection Analysis (Thess et al., 1996). However, a number of the methods are not very selective for lack of sensitiveness and they may also take a lot of time as well as involve a lot of money, especially when instruments are considered (Su et at., 2000). An evaluation of the various discussed methods which could be used in determining sulfite is presented in Table 8.
Studies have revealed that:
Carbon nanotubes can be used to promote electron transfer reactions when used as electrode material in electrochemical devices, electrocatalysis and electroanalysis processes due to their significant mechanical strength, high electrical conductivity, high surface area, good chemical stability, as well as relative chemical inertness in most electrolyte solutions and a wide operation potential window (Fan et al., 1999).
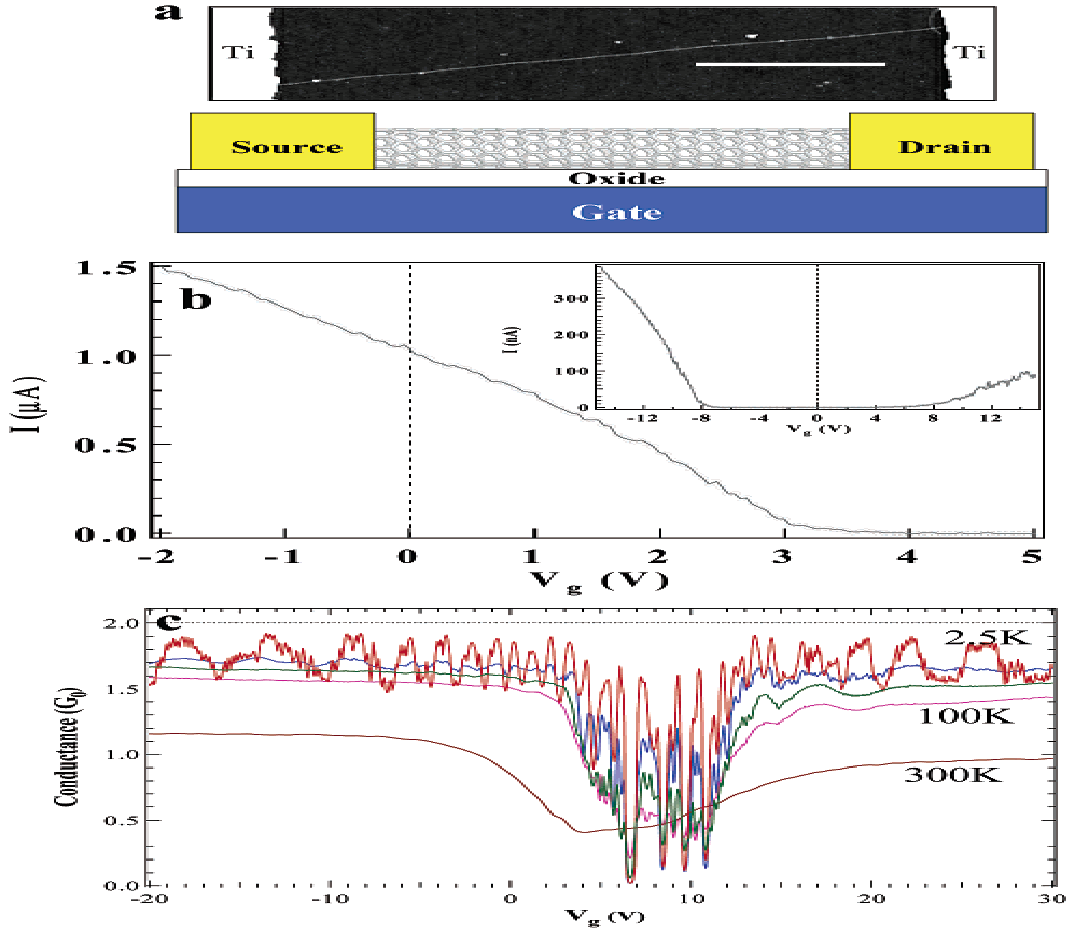
Fan et al (1999) has also presented an instance where results from experiments on stability of nanotubes were affected electronically. Individual electrical properties of nanotubes are presented by Hongjie (2002) as shown in Figure 1, above.
Description
Carbon Nanotubes have been found to posses a distinctive crystal structure which is usually tubular in shape or could be hollowly closed and comprise atomic arrangements in uniform pentagons, heptagons, as well as hexagonal shapes gotten from carbon which explains the stability of carbon suspensions. Carbon suspensions can be stable for a number of days at temperatures which are ambient and which also particularly have less than 30 μm grain content. In some instances, the grain composition is even less than 20 μm according to Dai (2001) who contends the following:
‘a concentration of carbon nanotubes in the supernatant of the suspension at least equal to 80% of the concentration used, and for carbon nanotube concentrations ranging from 1 to 50 g/l, in particular from 5 to 20 g/l and more particularly from 10 to 20 g/l’ (Dai, 2001).
The chemical behavior of nano-tubes is discussed by Hongjie (2002) who has also presented a figurative interpretation of the behavior as shown in Figure 2 below:
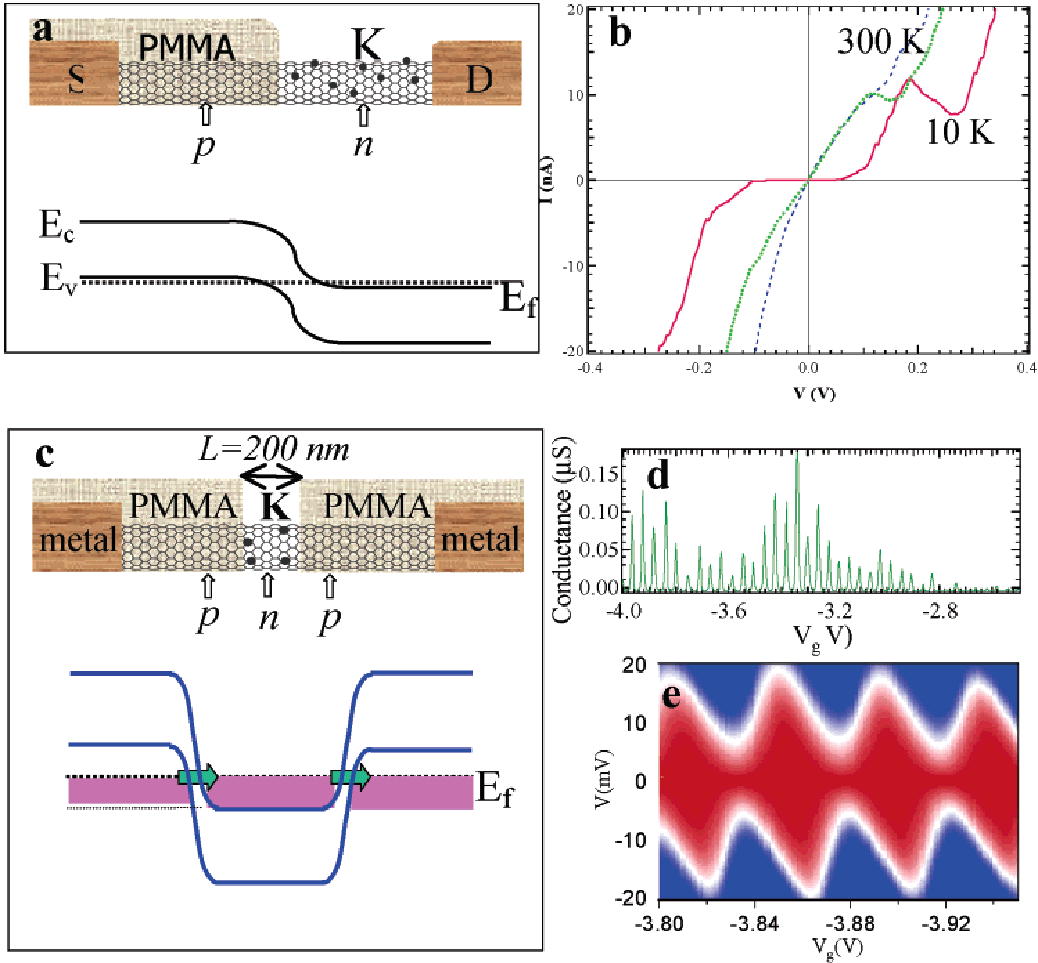
The data for information in figure 2 was obtained through ultrasonic method. When ultrasonic method of treatment is made use of, it should at least last for a period of ten minutes and should be at 20 kHz frequency. Franklin and Dai (2000) emphasize from results of their experiment that:
‘The Applicant has demonstrated that the passage of the carbon nanotube suspension under ultrasound constitutes a preferred alternative treatment in the case in which a film is to be formed subsequently from this suspension’ (Franklin and Dai, 2000).
Carbon suspensions can particularly be used in the reinforcement of polymarized matrices such as in fabrication of materials which have components that are electronic in nature.
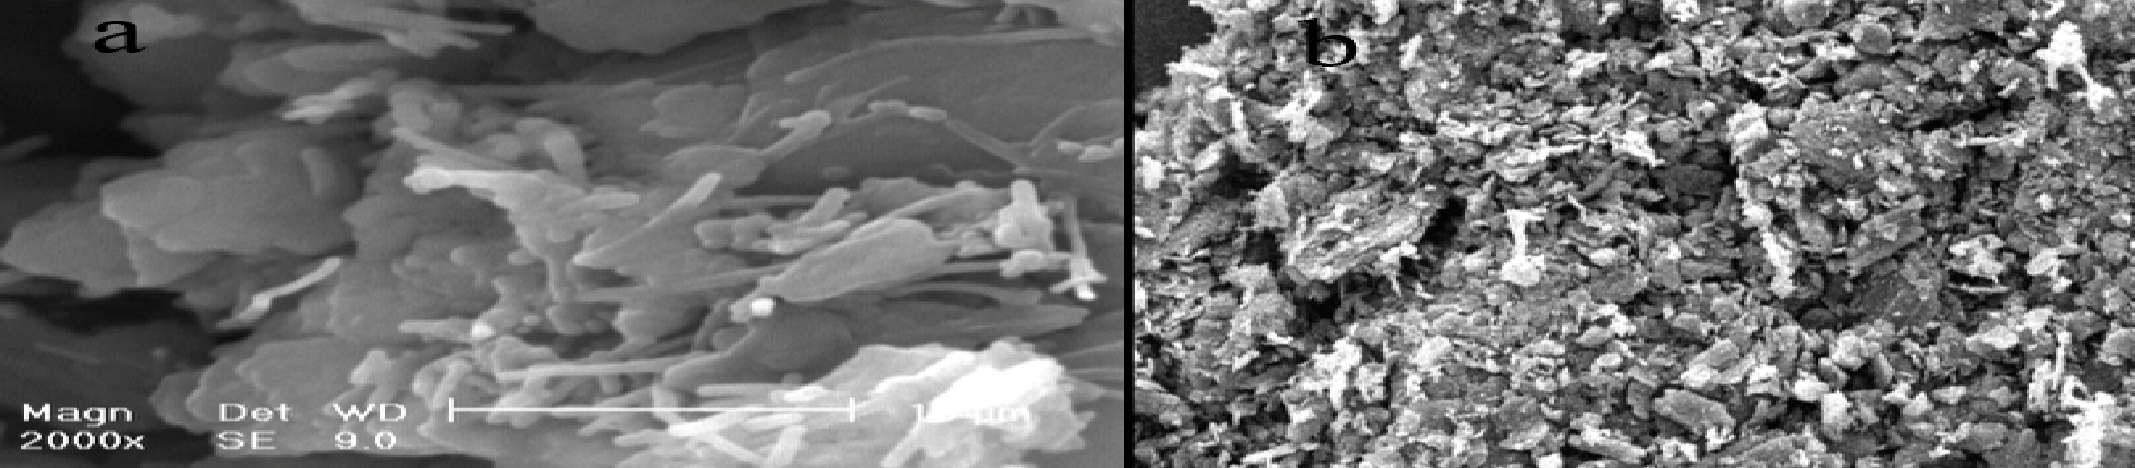
Sem Characterization of Multiwall Carbon Nanotubes (Mwcnts)
A basic outlook of a modified Multiwalled Carbon Nanotubes is shown in Figure 3 below. The figure displays Ferrocenedicarboxylic acid as containing paste electrodes in (a), and an unmodified carbon containing paste electrodes in (b) which is SEM-characterized. It can be seen from the figure that Ferrocenedicarboxylic acid has little or no effect on changes in the appearance of CNTs, even though it has some level of influence. But then, it is explicitly visible to notice the homogenous dispersion of MWCNTs.
Significance and Applications of Findings
The findings from the experiment are of immerse significance in several fields. This is because Carbon Nanotubes constitutes an uppermost strength when compared to its ratio by weight and that of other materials in the knowledge of researchers. This is indicated by combination of Carbon NAnotubes with a number of composite materials in spacecraft-building at the NASA as it is noted by Zhang et al (2001).
The study is also significant in explaining the high penetrative ability through membranes of cell walls by nanotubes. Specifically, the shapes of nanotubes when made into minuscule needles can be likened to their ability to penetrate cellular materials conveniently and without stress. This property of nanotubes is presently been considered by researchers in medicine in treatment of cancer. Another vital application of the studies has been noted regarding the resistivity of electric charges (Cassell et al., 1999). This particular property is been utilized in the development of sensors for the dictation of chemical vapours, biological molecules, and carbon monoxide.
Generally, Colomer et al (2002) stated that related applications of this studies are as follow:
Lightweight windmill blades made with an epoxy containing carbon nanotubes. The strength and low weight provided by the use of nanotube filled epoxy allows longer windmill blades to be used. This increases the amount of electricity generated by each windmill. Aircraft using carbon nanotubes to increase strength and flexibility in highly stressed components. Nanotube electrodes in thermocells that generate electricity from waste heat. Inexpensive nanotube based sensor that detects bacteria in drinking water. Antibodies sensitive to the particular bacteria are bound to the nanotubes, which are then deposited onto a paper strip. When the bacteria is present it attaches to the antibodies, changing the spacing between the nanotubes and the resistance of the paper strip containing the nanotubes. And, Combining carbon nanotubes, bucky-balls and polymers to produce inexpensive solar cells that can be formed by simply painting a surface (Colomer et al., 2002).
Conclusion
This paper has discussed nano-tubes and suspension as well as stabilization which make use of Multi-Wall-Carbon-Nanotubes (MWCNT) by function of concentrated SDS. The stabilization of the suspension is attained using 1ml to 5ml SDS and 1ml to 10ml DTAB. Several experiments were carried out for the benefit of authenticity of result and data from the experiments were obtained, tabled and discussed as an effort for determining the aqueous stabilization of Multi-walled-carbon-nanotubes (MWNTs) in the availability of a concentrated solution of Sodium Dodecyl-sulfate (SDS). Multi-walled carbon nanotubes (MWNTs) were easily dispersed in the several model solutions of Sodium Dodecyl-sulfate in aqueous suspended form and at the end of the experiment; this was noted to attain stability.
Reference List
Cassell, A., Franklin, N., Tombler, T., Chan, E., Han, J., et al., 1999. Directed growth of free- standing single-walled carbon nanotubes. J. Am. Chem. Soc. 121, pp.7975-7976.
Colomer, J., Stephan, C., Lefrant, S., Tendeloo, G., Willems, I., et al., 2000. Large-scale synthesis of single-wall carbon nanotubes by catalytic chemical vapor deposition (CCVD) method. Chem. Phys. Lett. 317, pp.83-89.
Dai, H., 2001. Controlling nanotube growth. Phys. World, 13 (6), p.43-47.
Dekker, C., 1999. Carbon nanotubes as molecular quantum wires. Phys. Today, 52, pp.22-28.
Dresselhaus, M. Dresselhaus, G. and Avouris, P., 2001.Carbon Nanotubes. In Topics in Applied Physics Springer: Berlin.
Fan, S., Chapline, M., Franklin, N., Tombler, T., Cassell, A., et al. 1999. Self-oriented regular arrays of carbon nanotubes and their field emission properties. Science 283, pp.512-514.
Franklin, N., Dai, H., 2000. An enhance chemical vapor deposition method to extensive single- walled nanotube networks wit directionality. Adv. Mater, 12, pp.890-894.
Hongjie, D., 2002. Carbon Nanotubes: Synthesis, Integration, and Properties. Chem. Res., 35, pp.1035-1044
Journet, C., Maser, W., Bernier, P., Loiseau, A., Delachapelle, M., et al. 1997. Large- scale production of single-walled carbon nanotubes by the electric-arc technique. Nature , 388, pp.756- 758.
Kong, J., Yenilmez, E., Tombler, T., Kim, W., Liu, L., et al., 2001. Quantum interference and ballistic transmission in nanotube electron wave-guides. Phys. Rev. Lett. 87, p.106.
Liang, W., Bockrath, M., Bozovic, D., Hafner, J., Tinkham, M., et al., 2001. Fabry-Perot interference in a nanotube electron waveguide. Nature, 411, pp.665-669.
McEuen, P., 2000. Single-wall carbon nanotubes. Phys. World, 13 (6), pp.31-36.
Nikolaev, P., Bronikowski, M., Bradley, R., Rohmund, F, Colbert, D., et al. 1999. Gas- phase catalytic growth of single-walled carbon nanotubes from carbon monoxide. Chem. Phys. Lett, 313, pp.91-97.
Satishkumar, B., Govindaraj, A., Sen, R., Rao, C., 1998. Single-walled nanotubes by the pyrolysis of acetylene-organometallic mixtures. Chem. Phys. Lett, 293, pp.47- 52.
Su, M., Zheng, B., Liu, J., 2002. A scalable CVD method for the synthesis of single- walled carbon nanotubes with high catalyst productivity. Chem. Phys. Lett., 322, pp.321-326.
Thess, A., Lee, R., Nikolaev, P., Dai, H. J., Petit, P., et al.,1996. Crystalline ropes of metallic carbon nanotubes. Science, 273, pp.483-487.
Yawun, J., Bronikowski, M., Azamian, B., Nikolaev, P., Colbert, D., et al., 2008. Catalytic growth of single-wall carbon nanotubes from metal particles. Chem. Phys. Lett., 296, pp.195-202.
Zhang, Y., Chan, A., Cao, J., Wang, Q., Kim, W., et al., 2001.Electricfield- directed growth of aligned single-walled carbon nanotubes. Appl. Phys. Lett., 79, 3155- 3157.