What is GDP?
Gross domestic product (GDP) is a measure of the value of all services and goods produced in a certain period of time. If GDP is negative, the contraction of the economy occurs, while if it is positive, the growth of the economy is observed (“Gross Domestic Product,” 2017).
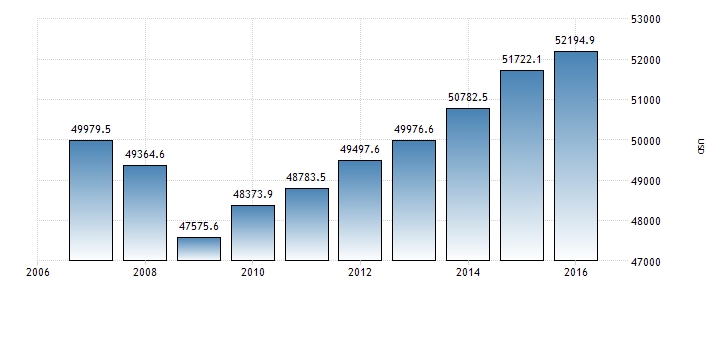
There are three ways in which GDP is measured. The first way is the output measure. This is the value of the services and goods produced by all sectors of the economy including the government, service sector, construction, energy, manufacturing, and agriculture. The second way of measuring GDP is the expenditure measure. This is the value of the services and goods purchased by the government and by household, investment in buildings and machinery. The third way of measuring GDP is the income measure. This is the value of the income that is generated chiefly in terms of wages and profits. Figure 1 shows the GDP of the USA per capita.
Limitations of GDP
In general, GDP is a reliable method of calculating the state of an economy and measuring the quality of life in a particular country. However, GDP only provides the overall production value for a particular period and does not take into account the source of growth or its beneficiaries.
Thus, it is impossible to adequately measure economic welfare unless the distribution of personal income is known. Additionally, GDP cannot determine whether the final services and goods produced during a certain period of time are the reflection of the real expansion of wealth, or the representation of capital consumption (“Gross Domestic Product,” 2017).
Price Index Change Measurement
Price indices are special tools used for measuring price changes for a certain number of services and goods. Therefore, broad price indices, particularly the gross domestic product and the consumer price index (CPI) are used for measuring the level of inflation in the economy, whereas narrow price indices, for example, the consumer price index for the elderly (CPI-E), are used for measuring the inflation that specific groups of industries or people experience.
The price index can be accurately calculated when a basket of goods and a base period are specified. The base period is the period of time against which the costs in other periods are compared. The basket of goods is the prices that are compared (“Price index,” 2017).
The Importance of Business Cycle
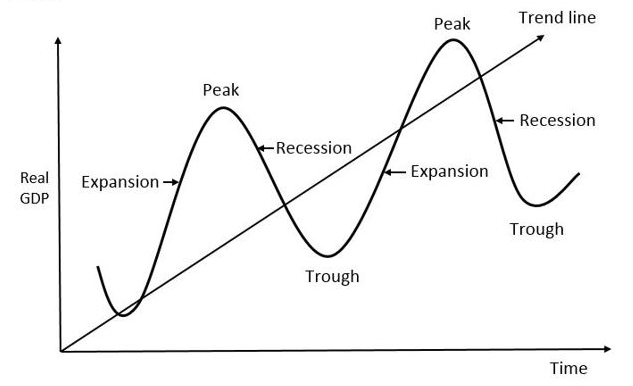
The business cycle is the cycle of expansion and recession in the economy. Understandably, all businesses try to avoid the recession, as it increases unemployment, where because of the decrease in demand, companies reduce production. However, a recession can reduce inflation and restore its normal levels. The expansion in the economy is very important for business, as it supports the prosperity of labor and economic growth. Thus, Figure 2 shows how the business cycle looks like.
The Labor Force Participation Rate
The labor force participation rate is a measure of the active labor force of an economy. It is the number of people who are both employed or actively searching for work (Kiersz, 2017). For example, Figure 3 shows the labor force participation rate of the USA.
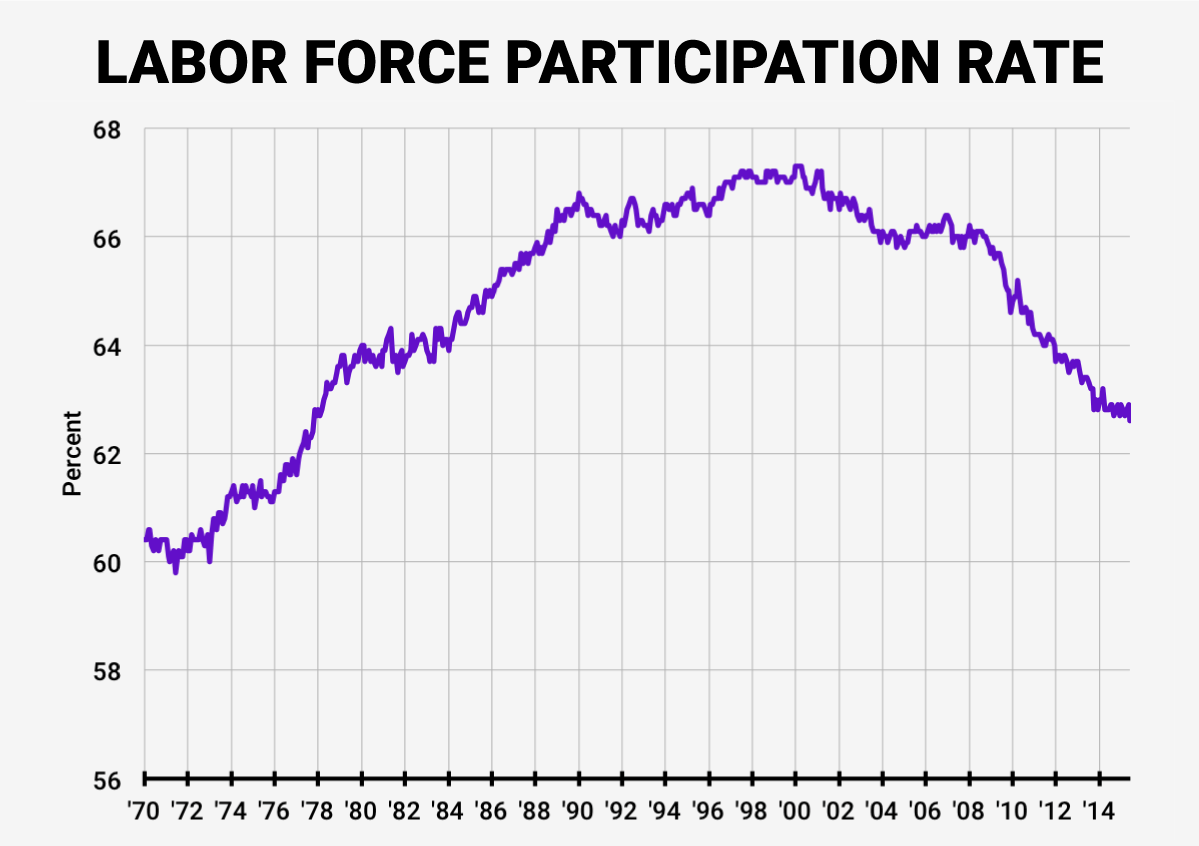
The formula used to calculate the labor force participation rate is as follows: LFPR = LF / P, where LF is the labor force, and P is the eligible population including both economically active and inactive populations (Kiersz, 2017).
For example, a Prime Minister of some country asks a Minister of Labor to prepare a report of the labor force participation for the previous year. The Minister of Labor finds out the total eligible population of the country, which equals 1,563,758, and the labor force, which equals 1,001,352. Thus, he makes the following calculation: LFPR = 1,563,758 / 1,001,352 = 0.64. The quotient is converted to a percentage by multiplying it by 100 and adding the percent sign: ~ 64%.
References
Gross Domestic Product. (2017). Web.
Hamel, G. (2016). What is a business cycle & why is it important? Web.
Kiersz, A. (2017). Labor force participation ticks up. Business Insider. Web.
Price index. (2017). Web.