Introduction
This paper is based on the topic of elasticity. It explores the topic by looking at the concepts of own price and income elasticity of demand. The paper also evaluates how the understanding of these concepts may help me as the manager of a luxurious family owned hotel in Edinburgh. In addition, the paper uses the concept of elasticity to explain other related concepts such as market power, arbitrage, demand curve, and price discrimination.
Discussion
Elasticity
The concept of elasticity measures how different economic variables relate to each other (Emmanuel, Slemrod & Giertz 2012). Examples of economic variables include price, supply, demand, quantity, and quality. For example, if the price of a certain commodity is lowered, elasticity looks at how many people would purchase that commodity. In an ideal situation, the lowering of the price would attract many people and as a result, the demand of that commodity would go up (Mulhearn & Vane 2012).
Own Price (Price Elasticity in Demand)
The concept of own price, also known as price elasticity in demand, is used to explain the relationship between the price of goods and services with their demand. In an ideal situation, when the price of goods and services goes down, the demand goes up (Fortlewis.edu: ECON 262: Demand elasticity n.d). The price of goods and services therefore determines their demand. Specifically, the concept of own price means the percentage change in the quantity demanded in response to a 1% change in the price (Griffiths & Wall 2011).
The calculation of own price is therefore done by dividing the percentage change in demand by the percentage change in price, while holding other factors constant. For example, if the price of a certain good or service increases by 30% and the demand decreases by 30%, then the own price of that good or service based on its initial price would be negative three (-3) (Griffiths & Wall 2011).
The reason for the negative is that there is an inverse relationship between demand and price (Griffiths & Wall 2011). The strength of own price is that it is capable of giving accurate measurements when the changes in price and quantity are below 20%. Its limitation is that when the changes in price and quantity are above 20%, the accuracy of own price decreases because the own price of goods is not always constant (Griffiths & Wall 2011).
Income Elasticity of Demand
Income elasticity of demand is a measure which explains the relationship between demand of goods and services with income (Griffiths & Wall 2011). In an ideal situation, the demand of goods and services goes up when income increases. Income elasticity of demand is calculated by dividing the percentage change in income by the percentage change in demand. For example, if the income in a certain community increases by 10% and the demand of a certain good or service increases by 10%, then the income elasticity of demand of that good or service would be one (10/10=1) (McAleese 2004).
In most cases, the relationship between income and demand of goods and services does not result to positive values. The reason is that goods and services are of different categories. The first category is known as inferior goods and services. This category comprises goods and services which are of low value and are mostly purchased when people have low income. However, when income goes up, the demand of such goods and services goes down because people opt for luxurious substitutes. Such goods and services therefore have a negative income of elasticity of demand as shown in the graph below
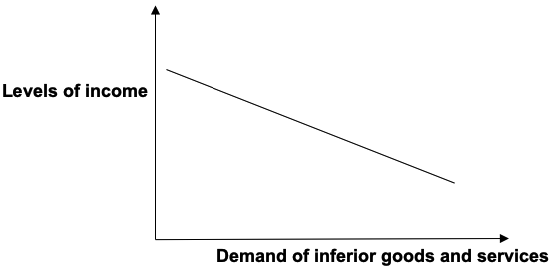
As shown in the graph above, when the income is high; the demand of inferior goods and services is low. The strength of income elasticity of demand is that it is capable of predicting the future demand of specific goods and services, which enables firms to invest wisely. Its limitation is that it does not give suggestions for stabilising the income of people in various income brackets (McAleese 2004).
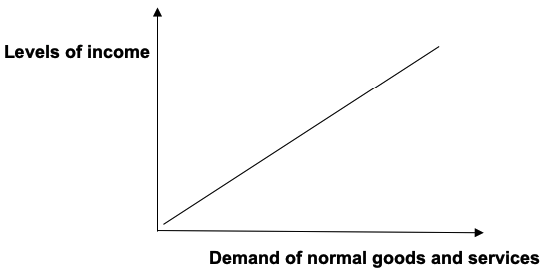
The second category is known as normal goods and services. This category comprises goods and services which have a positive income elasticity of demand. It means that an increase in income is accompanied by an increase in demand of normal goods and services (McAleese 2004). This category also has necessity and superior goods. Necessity goods are those whose income of elasticity of demand is less than one, while superior goods are those whose income of elasticity of demand is greater than one (Emmanuel, Slemrod & Giertz 2012).The graph for normal goods and services is as shown below
The third category is that of sticky goods or services. These are goods and services whose demand is not affected by the changes in income and as a result, their income elasticity of demand is usually zero (Armstrong & Kotler 2009).
The concepts of own price and income elasticity of demand may be useful to me as the manager of a family owned hotel in Edinburgh. The reason is that it would enable me to set fixed prices for the services of the hotel. If as the manager I would vary the prices of the services due to changes in the business environment, that variation would scare away customers (Ferrell & Hartline 2010).
The understanding of the concept of income elasticity of demand would compel me as the manager to conduct a research and establish the income bracket of the regular customers. As a result, I would be in a position to come up with marketing strategies which appeal to customers of that specific income bracket.
Market Power
Market power, also known as monopoly, refers to a situation in which a particular market is dominated by a single firm. The firm with monopoly usually dictates the price of goods and services by manipulating their supply. In many cases, monopolies are associated with exploitation of consumers due to lack of alternatives for the consumers. However, monopolies may not always exploit the consumers because governments may intervene and compel them to reduce the prices of goods and services (McEachern 2011).
The pricing strategy in a monopoly is not depended on business rivals. The firm which dominates the market sets the price indiscriminately, and is usually at liberty to charge different prices for the same good or service to different customers, depending on their ability and willingness to pay (McEachern 2011).
In an industry with a monopolistic structure, other small businesses are referred to as price takers. The reason is that they are not able to influence the price of goods and services because of the dominant player. As a result, they set their prices depending on the price set by the dominant player in the market. Those who deviate from the price set by the dominant player are forced to quit their businesses (Charyulu 2011).
Many monopolies are characterised by barriers to entry (Blythe 2006). Such barriers include things like pricing, marketing, and branding. It therefore means for new entrants to enter a monopolistic industry, they must have huge capital. They also need to invest immensely in marketing their businesses so as to gain a portion of the customers. The reason is that the firms which enjoy monopoly usually invest immensely in branding, which makes it difficult for new entrants to get customers for their goods and services (McEachern 2011).
Arbitrage
This term is used to refer to a type of trade which thrives on price differences in two markets. It is also a type of trade which is not prone to the usual business risks, meaning that the traders only incur the transaction costs. The trade depends on market research on the fluctuation of prices in certain markets. Arbitrage is common in the trade of stocks, bonds, securities, and currencies.
The reason is that the price of these items of trade is usually determined in advance and therefore, the arbitrageurs are guaranteed of a certain amount of profit. For example, if the price of a certain currency like the United States (US) dollar falls in a certain market, the arbitrageurs buy it in huge quantities and sell it in other markets where the price and demand are high. As a result, they are able to make huge profits within a short time (Vashisht 2005).
Even though arbitrage is a good business, it has its challenges. One of the major challenges is that it is not sustainable because it depends on the fluctuation of prices in different markets. Since it is not always guaranteed that the prices would vary, the arbitrageurs stay out of business until such a time when an opportunity presents itself. In other words, the arbitrageurs do not have control of the factors which shape their business.The other major challenge is that the business requires huge capital. As a result, few people are able to venture into it and that is why it is mostly done by financial institutions such as banks.
Demand Curve
The economies of many countries are influenced by the elasticity of supply and demand. Supply comprises the producers and suppliers of goods and services while demand comprises the consumers of the goods and services. In general economic principles, when the supply of goods and services is high, the demand is usually low. The concept of price shapes the relationship between supply and demand. The reason is that the price of goods and services is usually low when the supply is high. However, the price goes up when the supply is low. On the other hand, the price of goods and services is usually high when the demand is high and the supply is low (Blythe 2006).
In a competitive market, demand curve is a strategy used to determine the price of goods and services depending on their quantity. In an ideal situation, the price of a certain good or service fluctuates depending on the quantity supplied. If the quantity is low, the price goes up (Fortlewis.edu: ECON 262: Demand elasticity n.d). According to Sparknotes LLC, the demand curve is used to monitor the variation of price and quantity with the aim of establishing an economic equilibrium, where the quantity demanded by consumers at a certain price is equal to the quantity supplied or produced (Sparknotes LLC: Demand 2015).
The demand curve is drawn by plotting price against quantity, with price at the vertical axis and quantity at the horizontal axis (Emmanuel, Slemrod & Giertz 2012). One characteristic of the demand curve is that it usually slopes from left to right (Economics concepts.com: Law of Demand 2015). The shape of the curve is attributed to the fact that when the price of commodities falls, the demand increases (Emmanuel, Slemrod & Giertz 2012).
Price discrimination
It is a pricing strategy in which similar goods or services belonging to the same company are sold at different prices in different regions. It may also refer to the selling of similar goods or services to different buyers at different prices. Price discrimination is attributed to various reasons (Mortimer 2007). For instance, when there are many customers of a particular good or service in a certain market, the price of that good or service goes up.
On the other hand, if the demand of a certain good or service is low, the price goes down because there are few people willing to buy that good or service. However, in many cases, price discrimination is based on the ability of customers to pay for goods and services at certain prices. It is also based on mutual agreement between buyers and sellers. In some cases, sellers may lower the price for customers who purchase goods and services in bulk.
Conclusion
The concept of own price explains the relationship between the price of goods and services with their demand. It measures how the demand of goods and services responds to a 1% change in the price. Its strength is that it is capable of giving accurate measurements when the changes in price and demand are below 20%. However, its capability to give accurate measurements decreases when the changes in price and demand are above 20%.
The concept of income elasticity of demand explains the relationship between demand of goods and services with income. It is obtained by dividing the percentage change in income by the percentage change in demand. Its strength is that it is capable of predicting the future demand of specific goods and services. Its weakness is that it does not give suggestions for stabilising the income of people in various income brackets.
The concepts of own price and income elasticity of demand are useful to managers of big firms. The reason is that they enable the managers to make wise investment decisions and increase competitiveness. As the manager of a family owned hotel in Edinburgh, I would use these concepts to increase the competitiveness of the hotel and boost its profits. For instance, I would use the concept of own price to set fixed prices for the services of the hotel. I would also conduct a research to establish the income bracket of the regular customers of the hotel and come up with marketing strategies which target the customers in that income bracket. As a result, the hotel would realise growth and stability.
References List
Armstrong, G & Kotler, P 2009, Marketing: An introduction, Pearson Education Company, Prentice Hall.
Blythe, J 2006, Principles & practice of marketing, Cengage Learning, Farmington.
Charyulu, K 2011, Rural marketing, Pearson Education, Pearson, GA.
Economics concepts.com: Law of Demand 2015, Web.
Emmanuel, S, Slemrod, J & Giertz, S.H 2012. ‘The elasticity of taxable income with respect to marginal tax rates: a critical review’, Journal of Economic Literature, vol. 50, no.1, pp. 3-50.
Ferrell, O.C & Hartline, M 2010, Marketing strategy, Cengage Learning, Farmington.
Fortlewis.edu: ECON 262: Demand elasticity n.d, Web.
Griffiths, A & Wall, S 2011, Economics for business & management, Pearson Education, Prentice Hall.
McAleese, D 2004, Economics for business: competition, macro – stability and globalisation, Pearson Education, Prentice Hall.
McEachern, W.A 2011, Economics: A contemporary introduction, Cengage Learning, Farmington.
Mortimer, J.H 2007, ‘Price discrimination, copyright law, and technological innovation: evidence from the introduction of DVDS’, The Quarterly Journal of Economics, vol. 122, no.3, pp. 1307-1350.
Mulhearn, C & Vane, H 2012, Economics for business, Palgrave MacMillan, Great Yarmouth.
Sparknotes LLC: Demand 2015, Web.
Vashisht, K 2005, A practical approach to marketing management, Atlantic Publishers & Dist, New Delhi.