Phase three of the lab project survey involved collecting and analyzing data from eighteen randomly chosen neighborhood members. The data collected was on happiness and the scale provided was between one “low or no happiness” and seven “high levels of happiness.” The survey was administered using a guided questionnaire where participants were allowed to choose the best option that fits them on a scale of 1-7. The collected data was then analyzed using SPSS software, and the results were presented in this report. The primary purposes of the analysis report were to describe the statistical analysis used and the rationale for choosing it, the SPSS output, and the appropriate results graph.
The Statistical Analysis Used
The statistical analysis used was the Pearson’s correlation coefficient – used to test statistical association or relationship between two interrupted variables. It applies the covariance method to determine the association between variables (Gogtay, & Thatte, 2017). Finally, the Pearson correlation determines the magnitude of the correlation, associations, and relationship direction. The magnitude was crucial for the happiness study.
The rationale for Using the Above Statistical Analysis
The reason behind the Pearson correlation coefficient analysis was the questions being asked by the study to achieve its mission. The questions were;
- Do happiness and attendance have a statistically had meaningful relationship?
- Is there a direct statistical association between happiness level and attendance?
The method would tell if there was a correlation between the two variables by determining the exact degree or extend of correlation. Secondly, the test method would give the exact correlation direction, that is, if the correlation was negative or positive. The survey questionnaire asked participants if they were happy by using a value close to seven which was the maximum score, or unhappy by choosing one or values near it. The method would tell whether the relationship was positive or negative (Afyouni, Smith & Nichols, 2019). Furthermore, the Pearson coefficient calculation method enabled the calculation of the dependent variable with absolute reference to a specific value of an independent variable through preset regression equations. Another reason why the analysis was chosen is because it is easy to use. It is made up of numerous algebraic properties and a host of related factors viz to calculate the coefficient.
SPSS Output for the Analysis
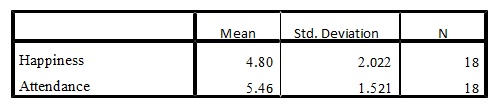
Descriptive Statistics Table
The Appropriate Graph
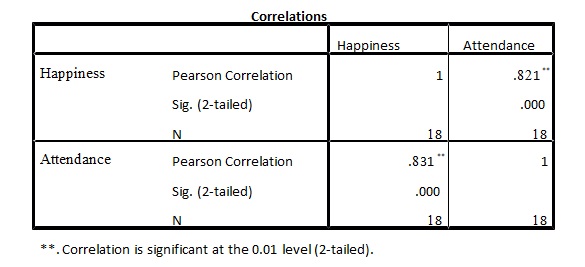
According to the descriptive statistics in table one above and the correlations in table two, the scatter plot shown below was the most suitable graph. To predict the exact association or relationship, the best-fit line graph would be drawn. The relationship results were obtained from the scatter plot, as is shown.
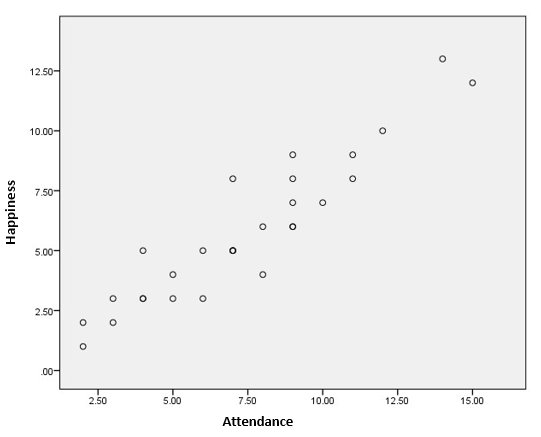
From the above graph, the computed Pearson correlation coefficient shows the presence of a relationship between the happiness and attendance of participants. The coefficient r = 0.821, p = 0.000 (p<0.01), and n = 18 thus the null hypothesis is rejected. The final results show a positive linear correlation; therefore, an increase in attendance causes an increase in happiness. The positive hypothesis is accepted.
References
Gogtay, N. J., & Thatte, U. M. (2017). Principles of correlation analysis. Journal of the Association of Physicians of India, 65(3), 78-81.
Afyouni, S., Smith, S. M., & Nichols, T. E. (2019). Effective degrees of freedom of the Pearson’s correlation coefficient under autocorrelation. NeuroImage, 199, 609-625.