Executive Summary
It is reasonable to believe that Google and Amazon’s current success is due to their focus on precision and aptitude for converting digital services into actual financial gains. Since both Amazon and Google operate in a market where disruption is a means of boosting competition, their accounting records can be regarded as powerful. Amazon is noticeably more reliable in terms of how it produces revenue and uses it to launch new services.
Introduction
Specific differences between Google and Amazon exist that cannot be ignored when deciding on the better route for organizational development. When examining Amazon, for example, it is essential to acknowledge that e-commerce activity forms the foundation of the company’s revenues, with cloud service provision being another key product (Gautier & Lamesch, 2021). Google’s operating income, on the other hand, stems from advertising (Rikap, 2022). Thus, Amazon’s most promising sectors are cloud computing and digital retail, which give the company stronger leadership on a long-term scale.
Financial Insights
A key aspect of Amazon is that the company continues to invest in e-commerce. It enables the company to consistently increase stock prices and investigate market trends (Lynn et al., 2019). At the same time, Amazon must manage stock splits to facilitate trading operations and ensure the company remains strong, regardless of market changes. Google’s stock is just as bumpy, but the advertising giant is expected to adjust all the prices and prevent a steep fall in stock prices (Gautier & Lamesch, 2021). Google can utilize existing services to ensure the company creates enough competition to battle Amazon and extend its reach.
Financial Trends and Consumer Behavior
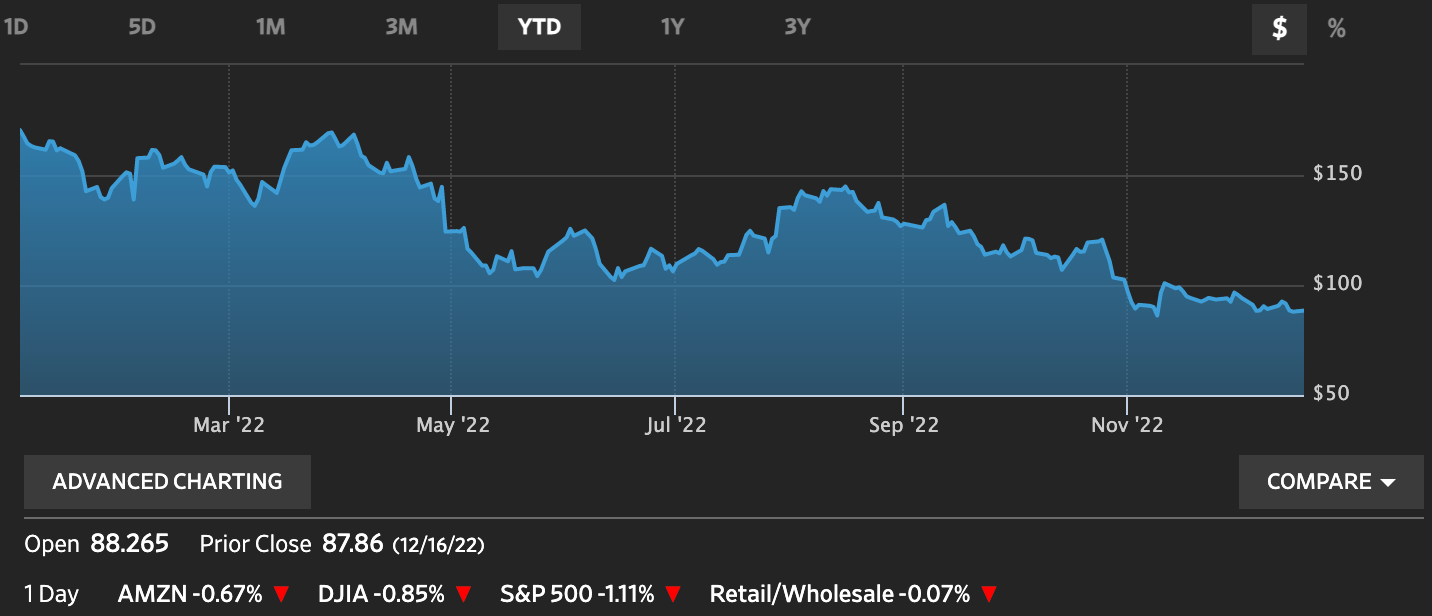
Regarding microeconomic trends, there are evident signs of a slowdown in overall consumer spending. This means that Amazon and Google are struggling with fourth-quarter sales and are seeing a decline in money generated from their usual activities. For example, Amazon’s market expectations were above $150 billion, and the company only obtained $147 billion (NASDAQ, 2021a). Among the macroeconomic aspects of Amazon’s operations is that its revenues continue to go down due to high inflation and energy costs. Similarly, Google feels the pressure generated by inflation and faces challenges due to consumer behavior.
With the slowdown in mind, it can be safe to point out Google’s struggle with potential consumers unwilling to spend their resources on advertising. These fluctuations are essential because they can predict a steep downfall (see Figure 1). As a result, while the market structure of the e-commerce industry and IT is based on product and marketing, the competitive environment of both companies is based on web services.

Most importantly, the cloud continues to grow, forcing both Google and Amazon to invest in the competition. The overall growth of revenue associated with Amazon Web Services surpassed 30%, making it impossible for Amazon to lose to Google regarding cloud service provision (Rikap, 2022). At the same time, Google’s limited market share and exposure continually contribute to a situation where expected revenue margins are reduced. Amazon’s approach to the cloud is much more robust and well-thought-out. In Figure 2, one may see Amazon’s consistency in service provision in areas where the two companies compete most.
Regarding key financial ratios, it is essential to analyze the financial health of the companies. The profitability ratio will involve the net profit margin for previous years. As seen from Table 1, according to Yahoo Finance data, the margin of Google from 2020 to 2021 increased by 31.8% (Yahoo Finance, n.d.-b). In turn, during the same period, Amazon saw an increase of 40%. Such growth might indicate that both organizations successfully increased their sales and transformed them into net income. However, while Google’s 29% margin is a good indicator, Amazon’s 7% is only average and can be considered a weakness for such a large company.
The liquidity ratio, such as the current ratio, does not indicate the same efficiency for both firms. For instance, Google saw a decrease in the current ratio by -4.5. In contrast, Amazon experienced an increase of the same ratio of 8.6% (Yahoo Finance, n.d.-a). Amazon and Google gained more liabilities, which might indicate that they will assign more funds for investments. However, although this can be a strength for Google, considering the company’s growing assets, it is a weakness for Amazon since its assets have decreased. What is additionally interesting is that Google’s ratio is much more robust, since a ratio of above 1 is good, a ratio of 2 or 3 is exceptional.
Table 1. Financial data of Google and Amazon
Conclusion
It is not wrong to assume that both Google and Amazon are winning significantly due to their attention to detail and the ability to turn digital services into real-life profits. With both Amazon and Google operating within an environment where disruption is one of the means of increasing competitiveness, their financial statements can be deemed powerful. Amazon is significantly more consistent in how it generates revenue and turns it around to deploy new services.
Reference List
Gautier, A. and Lamesch, J. (2021) ‘Mergers in the digital economy’, Information Economics and Policy, 54, 100890.
Lynn, T. et al. (2019) Disrupting finance: FinTech and strategy in the 21st century, Springer Nature.
NASDAQ (2021a) Amazon. Web.
NASDAQ (2021b) Google. Web.
Rikap, C. (2022) ‘Amazon: a story of accumulation through intellectual rentiership and predation’, Competition & Change, 26(3-4), 436-466.
Yahoo Finance. (n.d.-a) Amazon. Web.
Yahoo Finance. (n.d.-b) Google. Web.