Acknowledgements
Executive Summary
This essay explains the role of financial management in Nokia with reference to the historical, current and forecasted financial condition of the company. The financial planning, control and budgeting processes are explained with reference to the company. The financial analysis including ratio and trend analysis and vertical analysis has been performed using the financial statements of the company. The variance analysis is also performed using the budgeted and actual financial statements of the company. The forecasted financial statements of the company have been prepared for the next financial year. A capital spending project has been evaluated using the capital budgeting techniques including NPV, IRR and MIRR and the recommendations for the project have been stated.
Research Methodology
The objective of this essay is to present and evaluate the financial management structure of a company. The research approach used to address this presentation and evaluation is the quantitative approach. Information has been collected from various secondary sources for this essay The secondary sources used for this essay include the annual reports of the company for past five years, books on various topics related to financial management, journal articles and websites.
The qualitative methods of research usually give results that are well detailed and very rich in content that provides new concepts and ideas that will work to inform your program. The qualitative research methods will provide the researcher with information on how people and also on what mine workers think about the safety but it will fail to provide the information on how many people feel and think in that particular way.
If one researcher wants to carry out a research using the qualitative method, the following guidelines have to be used; the researcher will have to select a particular group of people who have similar characteristics in common and thereafter the researcher will have to convene a discussion by the use of either focus groups, interviews or observation of the behavior of an individual through such interviews such as the so called in-home interviews.
The researcher should make sure that the discussion he will start will not have a specific structure so that all the participating people will be free to pick the discussion from any angle and that no specific response will be required for specific questions. He should also have in mind that an interview guide can be used to ensure that the right questions are directed to the right people during the progression of the interview. These kinds of interviews usually have some kind of questions that are in a way very specific about issues of the project being researched on. For instance the semi-structured interview will have its own set of questions concerning the safety of the mine workers. These interviews though allow the interviewee to give very detailed answers to the questions.
Description of the Company
The company selected for financial analysis is Nokia and the information related to the industry and company. Nokia is part of the mobile communications industry which is now one of the most rapidly growing industries in the world. The rapid evolution of technology in the past 50 years has increased the dependence of individuals and businesses on electronic and wireless communications including mobile phones. The industry includes multinational companies and giants like” Motorola, Sony-Ericson and Samsung”. The mobile phone industry is highly competitive and technology oriented. The companies in this industry continuously upgrade services or features in their products to gain competitive advantage.
Nokia is almost a century and a half company with its roots in the paper, rubber and cable products. “The company is listed in various stock exchanges around the world including NYSE and NASDAQ. The company has six segments which are services and software, devices, markets, NAVTEQ and Nokia Siemens network. The company employs over 128,445 employees out of whom 39,350 employees are dedicated to research and development”.
Vision
‘Is to a leader in electronics and mobile phone handsets in the market through continues innovation.
Mission statement
The company’s mission statement is to be a leader in cell phone handset producer leader. Nokia is also committed to a role of environmental leadership in all facets of their businesses.
Objectives
- Built upon its fine products and services; especially since it prides itself in having exceptional customer service and interaction.
- Increase amount of expansions that Nokia has been experiencing, it has lost a sense of this consumer experience and it must regain it immediately.
- Increase market and become a market leader and innovator through producing its technologies through design and development of their own; this shows the company has a bright future.
Products
The company has a wide array of products and services which it offers to a variety of customers across the globe. The devices unit of the company is responsible for the development and management of cellular phones. ‘The services and software unit is responsible for internet services and software which include music, media, messaging services, games and maps’.
This paper focuses it attention to the companywide operations of the company.
My Duties and Responsibilities in Nokia and Focus of my Report
My main duties and responsibilities as management accountant are to prepare management reports to use for resource utilization. I am also required to identify and analyze viable projects that will be undertaken.
Effective Financial Planning and Budgeting
The old adage states that failing to plan is tantamount to planning to fail. Planning is therefore an integral part of organizational management. Without it, it would be impossible to allocate resources in a timely, fair and responsible way, to serve all the needs of the company. ‘Overspending on what is of least importance while starving the most important activities of the company would most definitely occur. This would lead to the inevitable bankruptcy of the firm since, all the money would soon be spent without any trace’.
Financial management involves the planning for future profitability and cash flows of an organization. ‘The major objective of financial management is to assess the current financial condition of business and plan for the future accordingly’:-
Financial management involves financial planning, financial controlling, budgeting, forecasting and making capital budgeting decisions based on various techniques. These functions of financial management help in achieving higher profitability and cash flows for the organization.
‘Financial planning is a way of allocation assets of the company for future use to generate wealth’. Companies make an investment which includes purchase of fixed assets which are depreciable, acquisition of subsidiaries and other long term purchases that are meant to increase the company revenue when used. ‘This are grouped as asset in the balance sheets’.
Types of Budgets
Categories of budgets
Management of Finance in Nokia
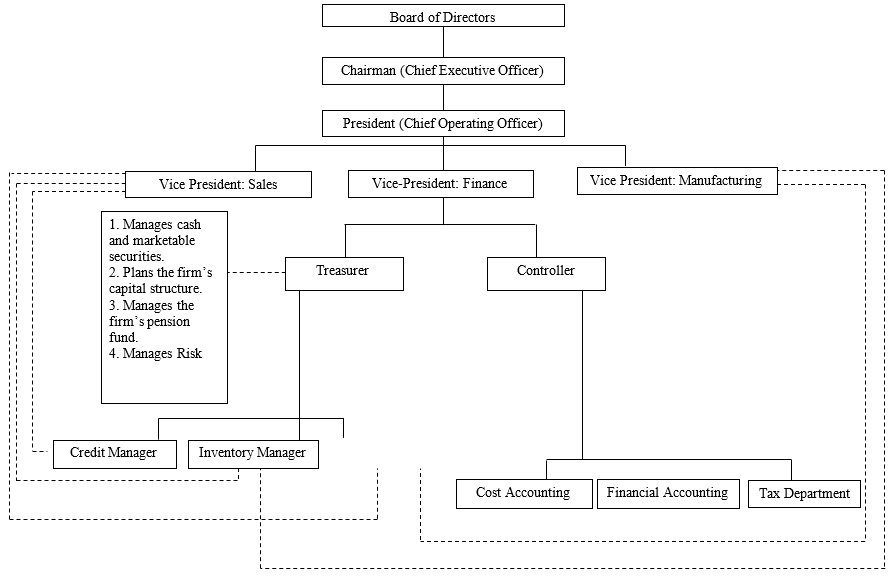
In Nokia organization the structure is designed according to the principle of Weber’s idea of bureaucracy. Duties and power are assigned to the positions, not to the individual holding that position. Financial management department arrange the structure according to the job specialization and hierarchical reporting chain. The financial management process involves the integrated efforts of the key personnel in an organization at various levels as shown in the diagram below
Information Technology
Nokia has diversified it products and its fundamental nature as mobile and information technology through the use of technology. The company has development it products using technology but based on the customer demands and changing needs.
The company shifted its move to the adoption of technology standards that was not implemented before in production of handsets. They also involve technology in purchasing. The pricing or valuing of the technology is estimated in terms of its long term profit to the company and value to its shareholders. Although the price acquisition is significant, the company looks into its long term goals to justify the acquisition. Nokia became the leader in adopting new technology standards that are widely available such as universal serial bus.
Strategic and Financial Management Planning
Financial planning strategies are objective-oriented while strategic planning cuts across the organization operations. The company corporate strategy deals with business-level activities which are designed from the board not from low level management.
Strategy formulation, implementation, and evaluation are the three important steps of the strategic management process. The beginning of the strategic management process is marked with the vision of the strategist. ‘Vision, mission, long term objectives, and environmental audit results are the important elements required for formulating a strategy’.
Financial analysis
The horizontal analysis is the comparison of two or three years of the financial statements values or ‘the financial ratios of an organization’.
Ratio Analysis
Liquidity
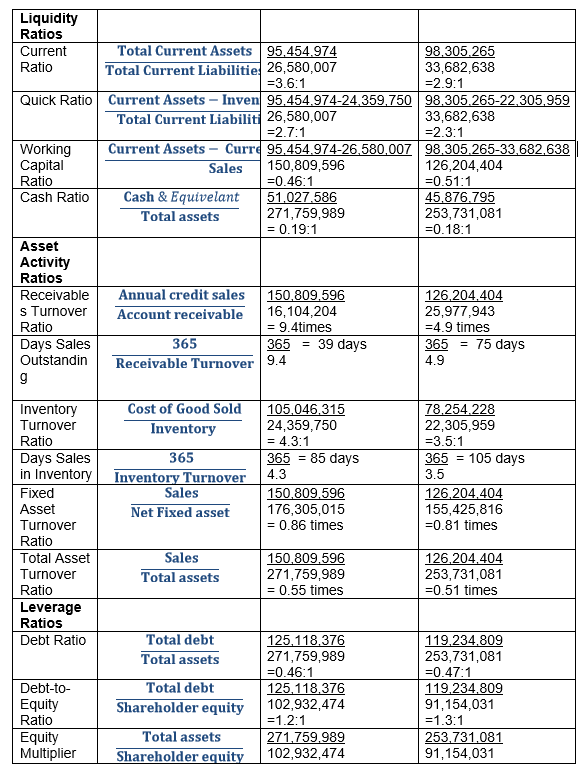
If a firm has sufficient net working capital i.e. excess of current assets over current liabilities, then the firm is assumed to have enough liquidity. Liquidity position of Nokia Company has been analyzed and a number of ratios were calculated for the 2 years for analysis purpose. The current ratio increased in year 2008 to 3.6 times from 2.9 in year 2007. This increase is due to rise in investment in debt securities and decrease in accrual expenses.
The acid test ratio of the company also depicts the same picture. It increased from 2.3 times to 2.7 in the same period. These ratios show that liquidity improves substantially during 2007 and 2008. Cash to assets and working capital stand at 0.46 and 0.19 percent respectively in the year 2008. While in the year 2007 it is 0.51 and 0.18 respectively. This is the same trend that is shown.
Activity ratios
This ratios shows the efficient of the management to utilize the company assets to generate liquid for day to day operations. The turnover ratios give the speed of conversion of current assets into cash in the above way. Receivable turnover ratio increased during the past 2 years. It saw its highest turnover during the years 2008 which result in day sales in receivable of 39 days only. Inventory turnover improved greatly during this period which was as high as 4.3 during year 2008 that is 85 days from 105 days or 3.5 times. It shows that company improves its performance in terms of converting its inventory into sales resulting in higher sales figure during the year 2008.
Financial Leverage Ratios
Financial leverage ratios provide an indication of the long-term solvency of the firm. They indicate the extent of non-owner claims on the firm’s profits as well as the firm’s operating capability to meet its obligation. Gearing is the long-term debt to equity ratio which assesses the balance between liabilities and equity in the firm’s long term resource structure.The calculations have shows that company is decreasing its reliance on creditor financing steadily starting from 1.3 times from 2007 to 1.2 times during 2008 for debt to equity. At the same time company is building equity finance during the same last 2 years.
This increase in equity finance came mostly from increase in retained earning of the company. The company paid no dividend to its outside shareholders. Instead it has decided to reinvest its annual profit into the business instead of relying on outside financing. The decrease in total liabilities seems to be due to equal decrease in current liabilities of the company. This decrease in current liabilities of the company, therefore, results in improved current and acid test ratio for the year 2008.
Profitability
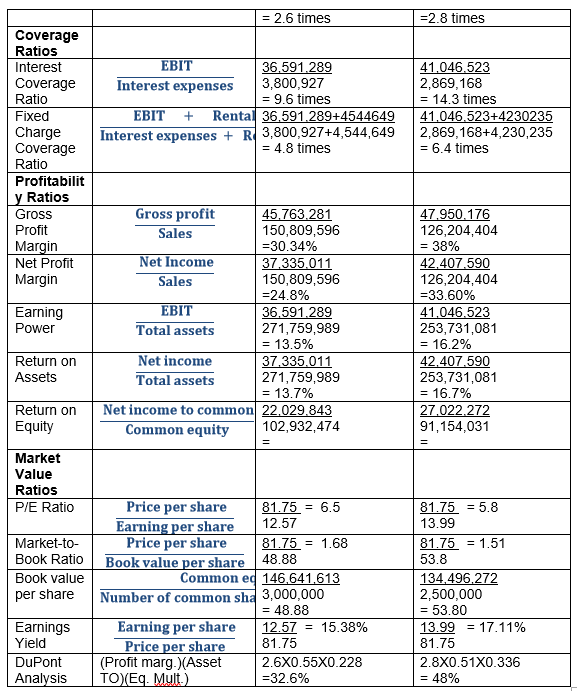
Profitability ratios are also called as the Efficiency ratios. As described above they measure the firm’s activities and its ability to generate profits. Gross profit Margin shows the profits relative to sales after the direct production costs are deducted. It may be used as an indicator of the efficiency of the production operation and the relation between production costs and selling price. Net profit Margin shows the earnings left for shareholders (both equity and preference) as a percentage of net sales. It measures the overall efficiency of production, administration, selling, financing, pricing, and tax management. Net profit margin, on the other hand, is the ratio of net income to sales. Return on common equity is a variant of return on investment. The return on common equity assesses the rate of return on the investments of common stockholders in the company. Another ratio is the turnover ratio which shows to what the extent the company uses its assets to produce revenue.
Variance analysis
‘Budgetary control is a method used to control the outcome of actual results as compared to estimated budgets’. The variance analysis is carried out by comparing the budgeted values with the actual values and any variances are calculated to make any changes necessary to the actual performance. ‘The performance of individuals who are working to achieve the budgets is also appraised using the budgetary control procedure’.
- The budgeted income statement has been prepared by applying a growth rate of 10% as indicated in the 2007 annual report of Nokia’.
- The budgeted sales for 2008 were €56,164 while the actual sales were €50,710 with an adverse variance of €5,454 million. This means the sales target has not been achieved and the main reason is the overall decline of the mobile phone industry.
- The budgeted cost of sales were €37,159 and actual were €33,333 with a favorable variance of 3,822 million. The main reason for the decline in the cost of sales is the decline in sales of the corresponding period.
- The gross profit is also lower than the budgeted amount and has a variance of €1,632 million because of the decline in sales.
- The operating profit of the business quite low as the budgeted amount was €8,784 and the actual is €4,966 which leads to a variance of €3,818. The net income of the company was budgeted to be €7,926 million while the actual net income is €3,988 with a variance of €3,938 million which is variance of almost 50%.
‘The adverse variances can be reduced by increasing sales of the company and decreasing the relevant expenses’.
Objectives and drafts of the next accounting period
The forecasted financial statements of Nokia provide information for the next financial year which can be analyzed to evaluate the profitability of the company.
- The expected growth rate of 12 % the company has a forecasted sales level of €56,795 million and a net income of €4,467 in 2009.
- The company requires a sales level above €52,500 to achieve profits. If the actual sales in 2009 are below this level the company would not be able to break even and would report a net loss.
- The balance sheet provides the forecasted levels for assets liabilities and shareholders’ equity in 2009 while the cash flow statement reflects the expected inflow and outflow of the company in 2009.
Budget
Highlighted figures represent budget changes.
The budget above sets out to avoid some of the projections that brought about problems in the realization of the previous budgets. All the altered areas from the previous budget are highlighted. Its main focus is to avoid losses occurring from poor overall performance of the company. It also aims to see to it that dividends are paid out at the end of the current financial year to both preferred and ordinary shareholders to restore confidence in investing in the company, and therefore increase returns on the company’s shares.
Main way of doing this is to redirect most of the money previously allocated to the mobile handset division to the other two divisions with the aim of improving their productivity.
- The IT division would benefit from 34,175 up from32, 104 in the previous budget. Sales would go up 14,411 up from 12,411. Part of this money is aimed to be used to pay employees in both departments a bonus as an incentive for better production, to be used for research and to boost marketing efforts. The marketing efforts would help reduce the backlog of inventory thus boosting income and reducing loss from excess storage. This would still leave € 1 M from the initial allocation to the defunct department that would be used for offsetting dividends at the end of the year, no matter what. The dividends would also benefit from a further € 1 M from cash previously allocated for restructuring in the defunct division.
- The other € 3.449 M would be redistributed to the Continuous Improvement (€ 0.449 M) for the sake of research and innovation. € 1 M would go into mopping up some of the debts incurred and sprucing up the assets left behind by the redundant division for disposing. € 1 M would be given for restructuring in the IT products division to make it more efficient. The other € 1 M would be held as contingency to help out in case of any unforeseen problems. The handset division would also benefit from an additional € 912,000 for its own restructuring program to help expand it. This would be cash formerly allocated for Continuous Improvement in mobile handset Harness. Finally the € 52,000 previously set aside for Lease obligations in the division would find a new home in the contingency unallocated fund.
The projected effects of these budgeting changes would be as highlighted in the tables below with the new figure highlighted and the previous figure in its original form.
Group Profit and Loss Account 2009 – 2010 € 000.
All changed figures highlighted for 2010.
Balance Sheet 2010 (€ 000).
Hypothetical Balance Sheet
Evaluation of Capital Investment Appraisal
‘Nokia can offer additional value added services to its consumers such as digital mapping and this can be used to increase the sales volume of the company thus increasing the cash flows and decreasing the payback period’.
In estimating the net present value Cash flows must be determined first for the new venture. The cash flows from the venture are;
Net present value = present value – initial investment

Assuming a required rate of return of 8% after tax and the tax rate of 40% and the project period 10years, the net present value will be as follows;-
Net present value = present value – initial investment

OR NPV = CF0 + PVIF10 8
= (16,500,000) + 2,610,000(6.71)
= 17513100 – 16,500,000 = 1,013,100
It gives a positive net present value of 1,013,100 therefore the project should be accepted.
Payback period = Net investment/Annual cash flows
Payback period = 16,500,000/2,610,000 = 6.3 years
The project has payback period of 6.3 years
IRR
IRR=the discount rate that causes a project to have a zero NPV.
It represents the average percentage return on the investment, taking account of the fact that cash may be flowing in and out of the project at various points in its life.
Decision rule- projects that have an IRR greater than the cost of capital are acceptable, the greater the IRR, the more desirable
16,500,000 = 2,610,000(1+IRR)8
Log 6.3 21= 8 log (1+irr)
Log 0.7902= log (1+irr)
= 16.87%
The project acceptable
Sensitivity analysis
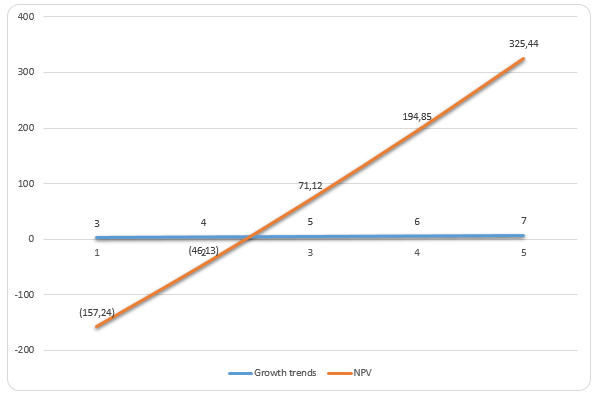
Sensitivity of NPV in this particular project is analyzed by changing the growth rates of the cash inflows (Economy Watch). The graph represents the changing values of NPV with reference to the change in the growth rate applied for the calculation o NPV. As the growth rate for the cash flows increases so does the NPV for the project in these different scenarios.
There are many subjective factors that should be considered before the investment decision is to be made, this should include, the possibility of a competitor opening a similar facility in the area thus affecting the market share. Another factor to be considered is changes in technology of the equipment. If the equipment is likely to have change technological innovations then, the decision to invest or not to invest will be affected. The other factor to be considered is the availability of spare parts for the lift in the market. Lastly, the political or government regulations will be considered. This is because the government regulations will cut across many factors affecting the profitability of the firm. The government is responsible for diffusing inflationary tendencies at the same time regulating monetary policy.
The net present value is not a correct measure for accepting the project, further analysis needs to be carried out to incorporate, inflation and other risk factors.
Report to the management
The capital budgeting model implies that the NPV of the project is €1,013,100 which is positive and the project should be accepted. The IRR for the project is 16.87%, and simple payback period is though between 6.3years which means the investment in the project will be recovered in 6.3 years. It was mentioned earlier that Nokia purchased NAVTEQ for future benefits rather than short term benefits which would help the company in value addition and increase the quality of service provided to customers.
Trend analysis and vertical analysis of the firm indicate a positive outlook for the company. The profitability ratios indicate that the company has managed to keep the company quite profitable as the ROE is 27.5%, the profit margin is 8% and the earning per share is 1.07. The company is also quite efficient in managing its assets as the inventory turnover ratio is 12.32 and the receivable turnover ratio is 4.91.
The company can pay-off its short term liabilities as the current and quick ratios are 1.2 and 1.08 respectively and both are higher than 1 which is a standard for these ratios. ‘The investment options in the company are quite healthy as well as the price earnings ratio is 10.37 and the dividend yield is 3.60%’. The company should invest the extra money in the project as it will increase the shareholders wealth. This is because NPV, IRR and payback period show a positive results.
Conclusion
The financial management tools and techniques can be applied to any organization to evaluate the overall financial structure with specific details as well. As competition become more and more intense, companies such as Nokia which are leaders in their industries can not afford to become complacent. Rather they must again pioneer developments in their fields. These companies have to integrate all their resources, use these resources efficiently and effectively to attain organizational goals.
As the investment becomes varied and as competition within industries becomes more intense, the need to effectively and efficiently manage resources to gain, develop and sustain competitive advantages is becoming more important. In integrating the strategic management to its overall strategy, Nokia must not forget that the most important factor in order for such strategy to succeed is its investment.
Works Cited
About.com. Definition of Budget, 2009. Web.
Arnold, Glen. Corporate financial management. Harlow: Financial Times Prentice Hall, 2007. Print.
Ayers, Ronald & Collinge Robert. Economics: Explore and Apply, Enhanced Edition. New Jersey: Pearson Prentice Hall, 2005. Print.
Brigham, Eugen. and Ehrhardt Michael. Financial Management: Theory and Practice. Florida: South-Western Educational Publishing, 2001. print.
Business Dictionary. Vertical Analysis, 2009. Web.
Dicuss Economics. Project Evaluation – Sensitivity Analysis (Cash Flow). 2008.
Economy Watch. Financial Management, 2009. Web.
Food and Agriculture Organization of The United Nations. Chapter 4 – Budgetary control, 1997. Web.
Graham, John. & Harvey Campbell. “The theory and practice of corporate finance: Evidence from the field”. Journal of Financial Economics 60, (2001), pp. 187-243.
Gup, Benton. Guide to Strategic Management. New York: Irwin Mc-Graw-Hill, 1980. Print.
Haka, Susan. “Capital budgeting techniques and firm specific contingencies: A correlational analysis”. Accounting, Organizations and Society 12: (1987) pp: 31–48.
Harvard Business School. Traditional Budgeting and Alternate Approaches, 2009. Web.
Investopedia. Horizontal Analysis, 2009. Web.
Klammer, Thomas. “Improving investment decisions”. Management Accounting (1993): 35–43.
Laitinen and Leppnen. Case Nokia Group, 2000. Web.
McLaney, Eddie. Business finance theory and practice; New York: Prentice Hall, 2003. Print.
Meigs, Walter and Meigs Robert, Financial Accounting. New York: McGraw-Hill Book Company, 1970. Print.
Mind Tools. Cost/Benefit Analysis, 2009. Web.
Myers, Steward. “Finance theory and financial strategy”. The Institute of Management Sciences 14 (1984), pp: 126–137. Print.
Nokia. Company, 2009. Web.
—. Compensation, 2008. Web.
—. Nokia in 2007. Annual Report. Espoo: Nokia, 2007.
—. Nokia in 2008. Annual Report. Espoo: Nokia, 2008.
Olson, David and Wu Deborah. Enterprise Risk Management. Singapore: World Scientific Publishing Company, 2008. Print.
O’Sullivan, Arthur, Sheffrin Steven and Perez Stephen. Economics: Principles, Applications and Tools. New Jersey: Pearson Prentice Hall, 2009. Print.
Pandey I. Financial management. New Delhi: Vikas Publishing House PVT ltd, 2009. Print.
PlanWare. Monthly Planning Calendars, 2009. Web.
Rao, Ramesh. Fundamentals of Financial Management. New York: Macmillan Publishing Company, 1989. Print.
Siciliano, Gene. Finance for the Non- Financial Manager. New York: McGraw-Hill, 2003.
Yahoo! Finance. NOKIA CP ADS, 2009. Web.