Introduction
Nowadays, the oil and gas business is a high-tech production chain, from raw material extraction and processing to final product sales. It might also ensure significant benefits for the companies operating there. However, the situation in the modern economy and geopolitics is constantly changing. This pushes the sector and the organizations that operate in it to adapt to atypical situations more rapidly to efficiently improve operations, manage costs, and avoid missing out on new profit opportunities. This article will investigate the financial situation and risk management qualities of Shell PLC and British Petroleum (BP) PLC, as well as their microeconomic environment.
Financial Performance Analysis
BP and Shell are two of the world’s most renowned energy businesses. The firms also play a critical role in the global oil and gas industry, with significant market share as shown in Figure 1:
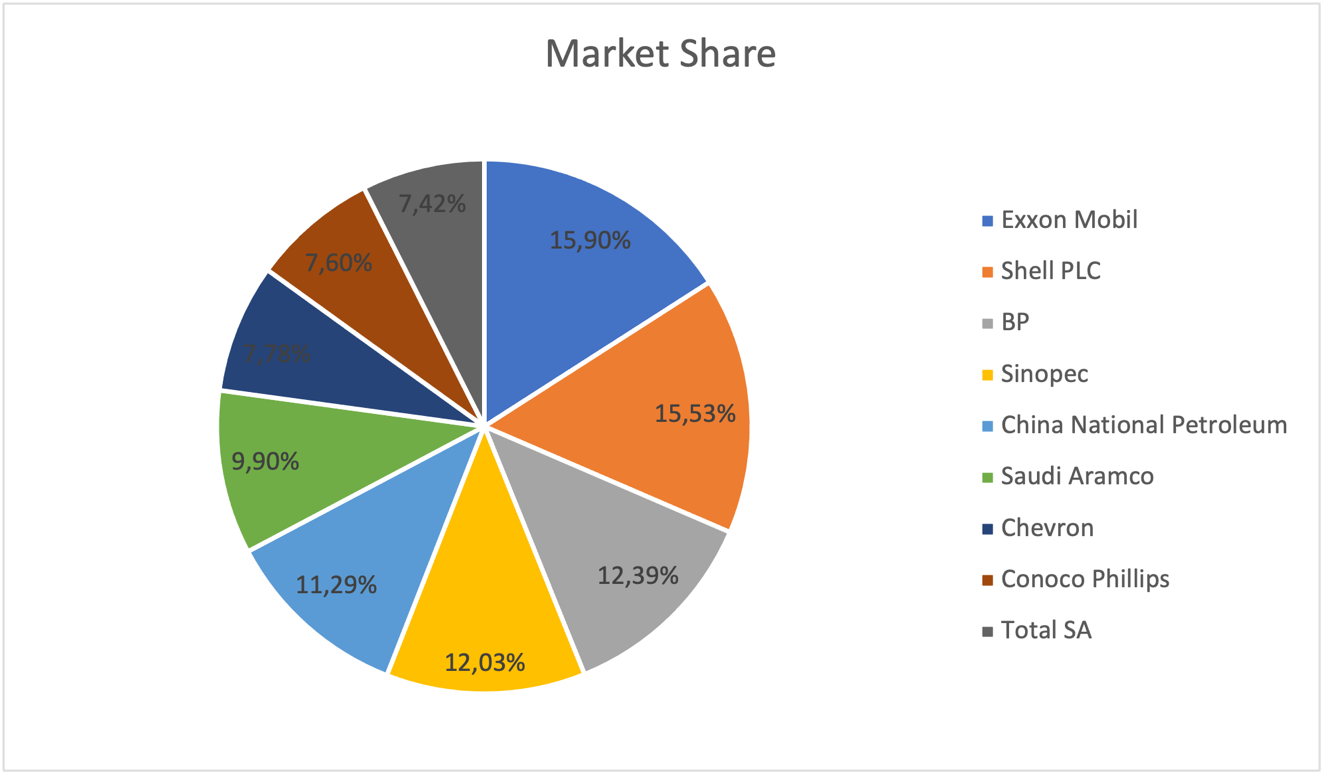
The companies work in a highly competitive market environment characterized by complex pricing. Shell and BP face low demand elasticity, meaning demand for oil does not change when its price increases or decreases (Kilian, 2020). It impacts the company’s internal and external policies and the interaction with competitors. As far as the brand’s role in the oligopoly market, it has stable relations with competitors because of the limited number of actors that could influence its performance.
An oligopoly is a market system in which only a few vendors exist (Dzhabarova et al., 2020). Oligopolists are highly dependent on one another in terms of pricing and overall behavior. It means they can engage in cooperation or discuss oil and final product prices. Because entrance to the oligopoly market is substantially more difficult, firms generate large profits.
Penetration into the sector is hampered by nearly identical restrictions to those of a monopoly. Among the most crucial are the capital required for a new business to enter the sector and existing firms’ control over the latest manufacturing processes and technologies (Dzhabarova et al., 2020). An oligopolistic market is distinguished by interdependence – the mutual reaction of a few rivals.
The companies are also regulated at the state level due to the scope of their operations and industry type. In national markets, regulatory agencies ensure prices are set correctly and that there is no corporate-backed monopoly (Shapovalova, 2023). At the global level, the Organization of the Petroleum Exporting Countries (OPEC) sets oil prices and extraction volumes (Shapovalova, 2023). In some cases, it might lead to failures when the costs become either too low or too high. For this reason, BP and Shell use a flexible pricing strategy depending on the global situation, local and international regulations, and current demand (BP, 2019; Shell, 2019). It helps avoid new failures and preserve high profitability.
The corporations have a fiscal year that begins on January 1 and ends on December 31. Royal Dutch Shell PLC, also known as Shell, is an independent business located in The Hague, Netherlands, that operates in the global oil and gas sector. The Royal Dutch Shell Group consists of energy and petrochemical firms with operations in over 70 countries(Shell, 2019). The Nederland Centraal Instituut Voor Giraal Effectenverkeer BV owns 44.1% of Shell (Shell, 2019).
The Upstream section includes operations such as exploration and recovery, liquefaction and transportation of oil and natural gas, and wind energy. The Downstream section is involved in the manufacture, distribution, and sale of chemicals and petroleum products. Finally, the Projects and Technology section encompasses all critical operations that support the company’s core business across both upstream and downstream divisions. The key data about the companies are located in Table 1.
Table 1: The Key Data
William Knox D’Arcy was the company’s founder. In May 1901, this accomplished Englishman was granted permission by the Persian government to prospect for and produce oil. D’Arcy engaged George Reynolds as principal engineer to locate oil. The firm did not provide any results in its early years. The company’s financial resources deteriorated due to a shortage of skilled workers, local attitudes, and the Persian government’s lack of support.
Burma Oil made another investment in Persian oil prospecting in 1905 (Our history, no date). BP’s origins date back to 1908, when oil was discovered in Persia following a long and arduous search (Our history, no date). This discovery laid the foundation for the Anglo-Persian Oil Company, which later became BP. There was much press discussion about the new company’s potential, and when its shares began trading on the London and Glasgow stock exchanges, people lined up to buy them. In turn, through its businesses, BP supplies consumers with transportation fuels, energy for heating and lighting, lubricants, and petrochemical products used to enhance and diversify daily life, such as paints, clothing, and packaging.
Despite BP’s vast operations, Shell has consistently generated more revenue than BP, thanks to its even broader scope. Over the past 10 years, Shell’s revenues have been 22.2% higher than BP’s (Shell, 2019). During the last four years, the wage difference has nearly doubled, rising from 16% to 23%. The net profit attributable to shareholders of Anglo-Dutch oil and gas firm Shell plummeted 32% year on year to $15.84 billion in 2019. BP hit $10 billion in 2019, significantly less than Shell (Shell, 2019).
At the same time, profit adjusted for changes in production costs (CCS) plummeted 36% last year to USD 15.27 billion in Shell. In the fourth quarter, the amount plummeted 8.5 times to USD 871 million (Shell, 2019). The report states that lower oil, gas, and liquefied natural gas (LNG) prices, as well as reduced refining margins, contributed to worsening financial performance (Shell, 2019). Total hydrocarbon output increased marginally year on year in 2019, reaching 3.665 million barrels of oil equivalent per day.
In turn, BP earned $785 million net of withholding taxes, up from $620 million in 2018, reflecting its portion of Rosneft dividends. Dividends equate to 50% of IFRS net income and are paid twice a year in accordance with the dividend policy introduced in 2017 (BP, 2019). Base substitute cost profit for the entire fourth quarter and the entire year 2019 was $2.6 billion and $10 billion, respectively, in contrast to $3.5 billion and $12.7 billion for the identical periods last year (BP, 2019). Payments for the Gulf of Mexico oil disaster totaled $2.4 billion after tax in 2019 and are likely to be less than $1 billion in 2020 (BP, 2019). Dividends of 10.5 cents per share were announced for the quarter, up 2.4 percent from the previous year.
Royal Dutch Shell Plc reported lower adjusted earnings in the fourth quarter of 2019, below market expectations. Shell’s adjusted profits and cost of production (CCS) plummeted 48% to USD2.93 billion in the October-December quarter, from USD5.69 billion in the previous year’s fourth quarter (Shell, 2019). For the period October-December 2019, Shell’s average realized liquids sales price was USD56.6 per barrel, a 5% decrease from the same period in 2018 (Shell, 2019).
The average realized natural gas sales price declined 23% year on year to USD 4.42 per thousand cubic feet (Shell, 2019). Shell’s adjusted E&P (upstream) profits reached USD778 million in the fourth quarter, down from USD1.881 billion the previous year (Shell, 2019). Downstream earnings decreased from USD 2.131 billion to USD 1.368 billion (Shell, 2019). Shell’s gas division earned USD1.986 billion, down from USD2.363 billion a year ago.
Access to reserves, political limitations, and rivalry for proven reserves, energy policy uncertainty, and cost control are the key concerns of the business in which Shell and BP compete. Crude oil, natural gas, petroleum products, and chemical prices are influenced by supply and demand at global and regional levels (Norouzi, 2021). Furthermore, macroeconomic factors may affect demand for our products. The pricing of crude oil, natural gas, petroleum products, and chemicals may also be affected by government activities. This may happen, for example, by encouraging the sale of low-carbon electric cars or even by prohibiting the sale of new diesel or gasoline vehicles in the future. One example is the prohibition that began in the United Kingdom in 2035.
Shell maintains a diverse portfolio to limit the impact of price volatility and manage these risks. The organization evaluates the viability of our projects and other prospects in light of changing prices for crude oil, natural gas, petroleum products, and chemicals. Shell also develops annual strategic and financial plans that examine and assess the impact of various pricing scenarios on our businesses and the company as a whole.
Throughout the year, these strategies are regularly examined (Li et al. 2022). In addition, the corporation seeks to maintain a healthy balance sheet to ensure resilience amid low market prices. BP’s risk management framework and policies are intended to provide a consistent, clear structure for managing and reporting risks associated with the group’s operations to management and the board.
The framework’s goal is to prevent accidents and optimize business success. It enables the organization to understand the risk environment, identify specific risks, and estimate potential exposure to BP (BP, 2019). It also helps determine how to address these risks to manage the overall risk effectively. The corporation also analyzes and seeks assurance that these risks are being handled successfully and takes steps to mitigate them when necessary. Through the system built, BP can report regularly to the chain of command and the board on how significant risks are managed, monitored, and validated, as well as how they are managed, monitored, assured, and what improvements are being made.
Microeconomic Environment
The industry’s peculiarities shape companies’ recruitment approaches. Shell and BP offer high wages for specialists with the desired skills, experiences, and competence (Careers at Shell, no date). Professionalism is considered the key to ensuring competitive advantage and avoiding mistakes (Careers at Shell, no date).
Both corporations look for specialists with expertise in the exploration, production, refining, and distribution of oil, natural gas, and associated products (Careers, 2023). This means that the occupations of engineers, chemists, top managers, and ordinary workers are usually associated with Shell and BP. By combining high wages with training, companies attain the best outcomes and preserve their leading positions.
Following the decline in the world’s major firms’ economic performance in 2020, with oil prices and transaction volumes recovering to pre-crisis levels in 2021, all of their main measures have recovered. Companies have taken significant steps to reduce costs and recover as quickly as possible. Exploration costs were reduced, several low-margin or unprofitable assets were sold in a low-oil environment, and assets expected to be profitable were retained. Many were retained, while many companies reduced their employee numbers (Norouzi, 2021).
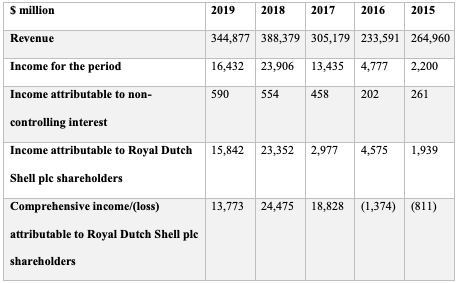
Investments in new projects were drastically cut, and either the most logistically convenient or the most marginal assets were picked. It is reasonable to say that the industry’s policies have created a significant incentive to evaluate the economic viability of individual projects and entire regions of operation. Table 2 summarizes Shell’s consolidated statement of profit or loss and comprehensive income.
Table 2: Consolidated Statement of Income and Comprehensive Income Data (Shell, 2019)
Rising demand for oil and gas is expected to drive market growth in the medium term, where Shell and BP operate. Furthermore, rising natural gas consumption, which necessitates expanding natural gas infrastructure, as well as increased offshore oil and gas exploration and production (EP) activities, are projected to drive the growth of the researched market (Norouzi, 2021). High volatility in oil and gas prices, on the other hand, is a key restricting factor for the industry. Nonetheless, new oil and gas resources discovered in various nations in recent years offer significant opportunities for the oil and gas market across all upstream, downstream, and transportation sectors, which are projected to drive growth over the projection period. British Petroleum’s forecast for 2020, compared to the previous year, is shown in Table 3.
Table 3: Forecast (BP, 2019)
Salary levels for both firms range from low to high. Shell recruits people for jobs such as cashiers, drivers, crew members, engineers, and storekeepers. BP, for its part, is seeking experts such as senior corporate technology engineers, demand distribution and trade channel optimization analysts, key account managers, fleet managers, and cashiers (BP, 2019). Decisions on the funding of individual refineries and other business units, as well as the allocation of available oil volumes, are required in vertically integrated corporate structures such as those of Shell and BP, and in the majority of other large oil firms (Gray et al., 2019). This circumstance makes it more difficult to directly apply strategic analysis and planning frameworks, such as the BCG matrix.
Another challenge is that such firms’ entire operations are based on a single technological and strategic line, with diverse business divisions using the same production equipment. Since the full range of goods for different market segments is produced by the same refinery, the related production volumes, costs, and profits are fully interrelated (Norouzi, 2021). In addition, it should be noted that products from one such refinery often compete with each other in the market.
Conclusion
Royal Dutch Shell Plc is the world’s leading oil and gas company, with a global presence across several nations. BP, for its part, is the market leader in the majority of its categories. In addition to being the leading player in the United Kingdom’s oil and gas industry, the corporation also plays a critical role in preserving the region’s economic balance. The analysis of the financial results, market structure, and the microeconomic environment evidences the effectiveness of both companies’ strategies.
The findings reinforce each other, showing that the brands take advantage of the oligopoly market and act in line with the significant terms of competition within it. Benefiting from favorable market conditions and international regulations, they increase sales and seek to diversify their production to reduce their dependence on oil and gas prices. As a result, Shell and BP show stable financial results and generate additional income. The low elasticity of demand means that clients will buy products regardless of price changes, which is helpful for firms. By analyzing market structure, the microeconomic environment, and financial performance, one can evidence the corporations’ strength.
Reference List
BP. (2019). Energy with purpose: BP Annual Report and Form 20-F 2019.
BP Careers (2023).
Careers at Shell (no date).
Dzhabarova, Y. et al. (2020) ‘Existence, uniqueness and stability of market equilibrium in oligopoly markets‘, Administrative Sciences, 10(3), p. 70.
Gray, B.J. et al. (2019) ‘Politics, climate change, and earthquakes: Public perceptions of oil and gas impacts in Oklahoma’, Energy Research & Social Science, 58.
International Energy Agency (2023) World energy outlook 2023.
Kilian, L. (2020) Understanding the estimation of oil demand and oil supply elasticities.
Li, M., Trencher, G. and Asuka, J. (2022) ‘The clean energy claims of BP, Chevron, ExxonMobil and Shell: A mismatch between discourse, actions and Investments’, PLOS ONE, 17(2).
Norouzi, N. (2021) ‘Post‐covid‐19 and globalization of oil and natural gas trade: Challenges, opportunities, lessons, regulations, and Strategies’, International Journal of Energy Research, 45(10), pp. 14338–14356.
Our history (no date).
Shapovalova, D. (2023) ‘Climate change and oil and gas production regulation: an impossible reconciliation?’, Journal of International Economic Law.
Shell (2019). Energy for a better future: annual report and accounts for the year ended December 31, 2019 Royal Dutch Shell PLC. Shell.