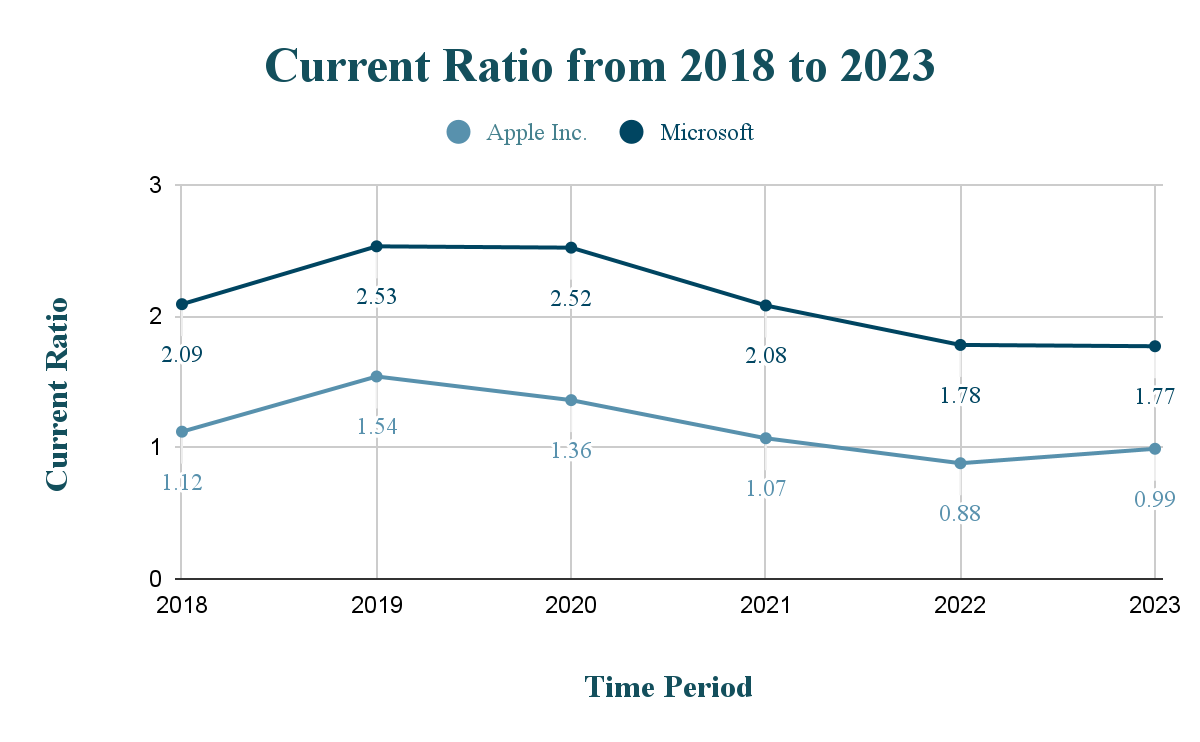
Current Ratio
Figure 1 shows Apple’s and Microsoft’s liquidity ratios. The dynamics are identical except for the last year, for which complete financial statements were not available until closer to spring 2024 (Apple, 2023a). Apple’s performance has been lower due to a significant reorientation of its capital structure towards debt, which has become its primary financial strategy since 2020 (Macrotrends, 2023a). The organization even dropped below one in 2022 and 2023, although the situation is improving, which may signal risks. Against the backdrop of growing revenue and market leadership through constant innovation, these omissions are more likely a consequence of financing large projects (Macrotrends, 2023a).
On the contrary, Microsoft is much more stable in terms of liquidity, and according to vertical analysis, it has a better ratio of more liquid assets in the form of cash on hand compared to receivables and inventories than Apple (Macrotrends, 2023b). In addition, Microsoft has more current assets and fewer liabilities. However, they have also increased significantly since 2020, when many companies received state subsidies and resorted to lending to maintain growth rates and achieve their goals, amid potential financial threats from COVID (Soni, 2020). At the same time, IT giants survived this crisis better than others by implementing cloud services, software for remote interaction, and more (Soni, 2020). However, Microsoft is more prudent with liquidity, thereby increasing its resilience in the face of prolonged crises such as the pandemic.
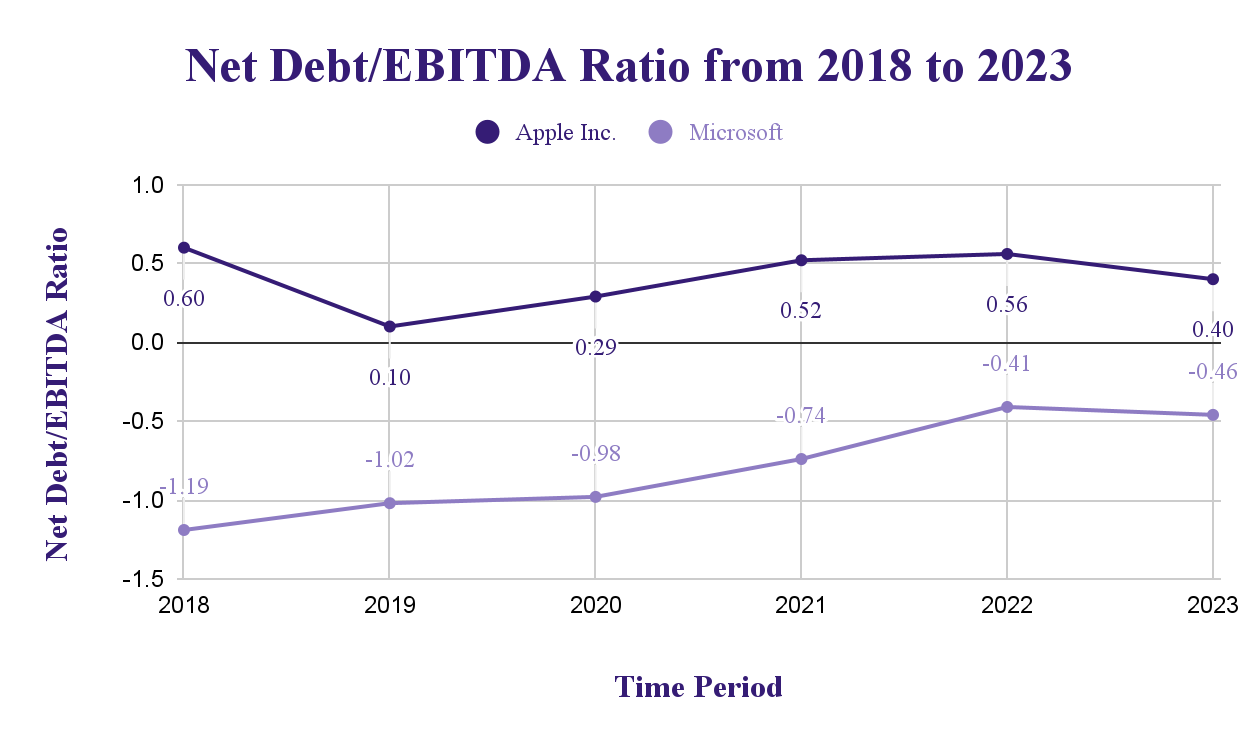
Net Debt/EBITDA
In Figure 2, the ratio reflects companies’ available leverage relative to their debt-to-operating income. The dynamics here are different, but Apple is again inferior to Microsoft due to its chosen focus on debt capital. The company’s net debt is growing, as reflected in the gradual increase in the indicator, but it remains within the allowed limits and does not exceed 1, which is not a signal to investors of problems (Macrotrends, 2023a). Apple consistently generates profits; moreover, given that the company’s line is updated every year, and we are not just talking about smartphones or accessories, the organization introduces new solutions in the field of processors – a stable income stream with this model due to innovation is a guarantor of sustainable growth (Apple, 2023b). This fact partially offsets the risky corridor of values in which the company fell, as shown in Figure 1.
Microsoft is also steadily increasing its debt, a trend that has become more noticeable since 2021, while the structure is such that long-term debt is falling and short-term debt is rising (Macrotrends, 2023b). The guarantor of EBITDA’s growth is the company’s cooperation with pioneers in artificial intelligence, OpenAI, of which Microsoft is a shareholder (Microsoft, 2023). At the same time, according to Figure 1, the IT giant has a margin for debt growth in terms of liquidity, which, together with the stable situation, makes the situation stable despite the deterioration of the indicator in Figure 2; however, it is still negative: Microsoft has more available money than actual debts.
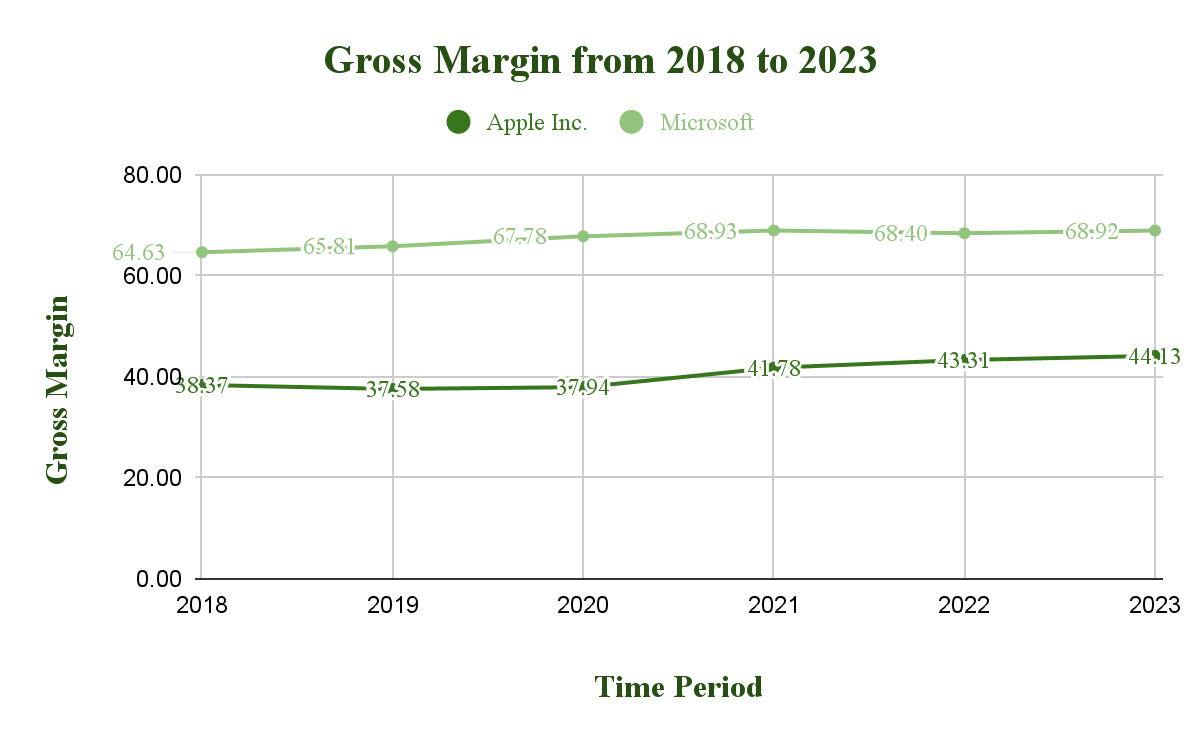
Gross Margin
Figure 3 shows the performance indicators of these companies. Once again, Microsoft shows much better value due to its lower cost of goods sold, while Apple’s is also high (Macrotrends, 2023a; Macrotrends, 2023b). The fact is that Microsoft’s business is much more focused on services than on products. In contrast, Apple, for example, requires extracting semiconductors, whose prices increase significantly due to political and environmental factors (Bown, 2020). However, Apple is growing on this indicator, which, given its net revenue growth, is a positive sign of the company’s stability for investors. At the same time, Microsoft is an even more reliable guarantor of preserving funds.
References
Apple. (2023a). 10-K Annual Report.
Apple. (2023b). Apple unveils MacBook Pro featuring M2 Pro and M2 Max, with more game-changing performance and the longest battery life ever in a Mac.
Bown, C. P. (2020). How the United States marched the semiconductor industry into its trade war with China. East Asian Economic Review, 24(4), 349-388.
Macrotrends. (2023a). Apple Balance Sheet 2009-2023 | AAPL.
Macrotrends. (2023b). Microsoft Balance Sheet 2009-2023 | MSFT.
Microsoft. (2023). Microsoft and OpenAI extend partnership.
Soni, V. D. (2020). Information technologies: shaping the world under the pandemic Covid-19. Journal of Engineering Sciences, 11(6).