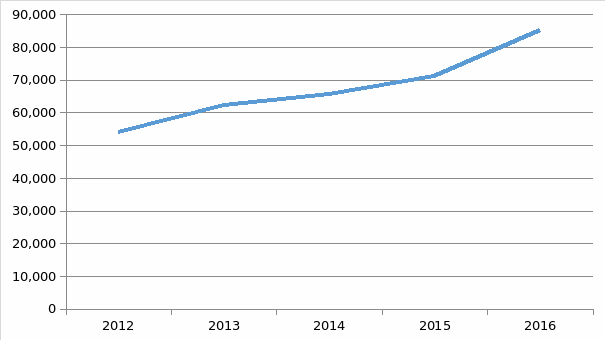
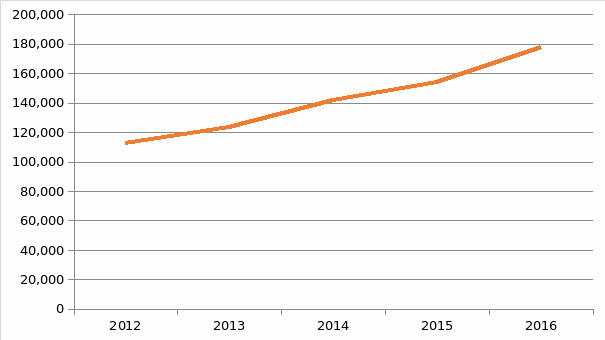
In 2016 and the first three quarters of 2017, GM has been experiencing significant financial issues, namely a steep growth in liabilities. According to the WSJ (2017), the company’s liabilities over the five-year period increased from 53,992 in 2012 to 85,181 in 2017 (Figure 1). As a result, GM’s total liabilities increased from 112,422 to 177,615 (Figure 2). This has created major liquidity issues for the company, as there are concerns that it would not be able to meet its liabilities.


The company’s Debt to Equity ratio is 1.89, which is significantly higher than a rule of thumb figure of 0.4 points. According to Dyer, Godfrey, Jensen, and Bryce (2016), a higher D/E ratio impairs the ability of the company to obtain debts needed to finance change or company growth. Moreover, GM’s result of the acid test ratio does not conform to the rule of thumb. The acid test ratio of the company is 0.73; as explained by Dyer et al. (2016), a ratio of less than 1 indicates liquidity issues and could potentially mean that the company is unable to meet its short-term liabilities.
The company’s current ratio is 0.89, which confirms the liquidity concerns. As a rule of thumb, current ratio should be above 2 (Dyer et al., 2016). Therefore it is clear that one of the leading financial concerns of GM is its liquidity and the ability to cover debts and other liabilities.
Further financial analysis indicates that the company does not use its key resources wisely. For instance, the company’s return on assets is 0.04, which is low even for the automotive industry, meaning that the company does not use its assets efficiently (Dyer et a., 2016). Furthermore, GM’s gross profit margin is 17.8%, which is relatively low, indicating a significant effect of variable costs on the profit.
Nevertheless, the financial analysis of GM also showed some opportunities for future growth. For instance, the company’s return on equity ratio is 21.4%, which is higher than the desired value of 15% or above. This shows that the company uses its equity capital efficiently (Dyer et al., 2016). Furthermore, the company’s EBITDA value was 20,671 million USD in 2016, marking a 37.08% increase from 2015. EBITDA is an indicator of the company’s operating performance; as noted by Dyer et al. (2016), it also reflects on the company’s capacity for funding acquisitions and capital investments.
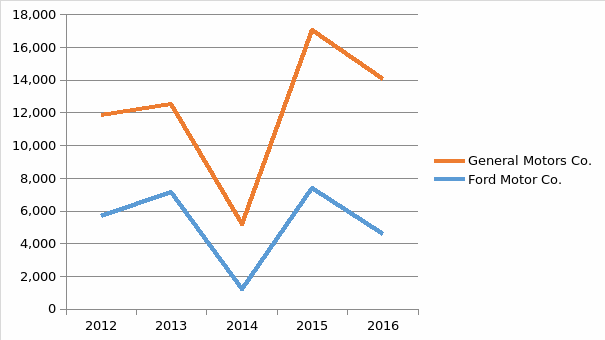
On the whole, GM’s financial issues are comparable to those faced by its key competitors in the automotive industry. For instance, Ford Motor Company had a net margin of 3.03% compared to GM’s net margin of 5.67% (WSJ, 2017). However, Ford Motor Co. also showed a significant decrease in its EBITDA, which puts GM in a more favorable position. Figure 3 indicates a comparison of net income between GM and Ford Motor Company.

Overall, despite its liquidity issues, GM has a positive return on equity ratio as well as EBITDA. The company’s net and growth profit margins are comparable to those across the industry, which means that the financial problems experienced by GM are a reflection of the market rather than its negative performance. Moreover, GM (2017) also suggests that some of its financial issues can be attributed to acquisition charges and other significant expenses that are likely to contribute to its profitability in the future. However, in order to ensure positive development and enhance productivity, it would be crucial for GM to manage its assets and liabilities effectively.
References
Dyer, J., Godfrey, P., Jensen, R., & Bryce, D. (2016). Strategic management: Concepts and tools for creating real world strategy. Hoboken, NJ: John Wiley & Sons.
General Motors Company (GM). (2017). Third-quarter 2017 earnings from continuing operations. Web.
The Wall Street Journal (WSJ). (2017) General Motors Co. Web.