Introduction
Germany, Greece, and the U.A.E are notable economies in Europe and the Middle East. Many countries have emulated their economic models (The Global Economy 2015). For example, Saudi Arabia has tried to emulate the U.A.E’s diversification strategy to decrease its reliance on the energy sector (The Global Economy 2015). This strategy has led to the growth of the non-oil sector and the emergence of new economic sectors such as tourism and real estate industries that contribute to the country’s Gross Domestic Product (G.D.P). Other Gulf Cooperation Council (GCC) countries have also emulated this economic model with varying successes (Mallakh 2014).
Germany is a leader in the European Union (E.U) because it has managed to maintain a positive balance of payment, even when most industrialized economies are struggling with current account deficits (Owen-Smith 2012). Experts have used this country’s economic success to emphasize the importance of fiscal and monetary discipline in the financial sector (Owen-Smith 2012). Comparatively, they have used Greece’s economic troubles to demonstrate what not to do in terms of national economic management (Close 2014). Based on an overview of these economic characteristics, this paper explores the characteristics of the three economies with the view of identifying unique similarities and differences that would help explain what makes the three economies tick.
This analysis provides adequate information to understand the current economic situation in the three countries and predict their economic outlook as well. To come up with a comprehensive understanding of this research focus, this paper explores three key economic attributes of these economies – unemployment rate, GDP growth, and balance of payments. These variables come from an assessment of the economic model Y= C+I+G+X-M. The Y = equilibrium level of national income, C = level of consumption of goods and services, I = domestic real investment in buildings, G = government expenditure, X = foreign expenditures on goods and services and M = the level of imports (in terms of goods and services purchased from other countries).
X and M explain the need to analyze the balance of payment as an important economic performance indicator, while C highlights the need to analyze unemployment (employment) rates. Lastly, Y and G emphasize the importance of analyzing GDP as another economic performance indicator. This study uses these variables as the main economic performance indicators. However, before comparing the economic performance of the three countries, this way, it is important to understand their characteristics first.
Economic Characteristics
Greece
Global economic statistics rank Greece as a developed and high-income economy (The Global Economy 2015). Greece is among the largest 50 economies of the world (The Global Economy 2015). Its purchasing power parity of $238 billion ranks it as the 51st largest economy in the world (Close 2014). Regionally, Greece is part of the European Union. Despite its troubles in the economic bloc, the country has the 13th largest economy in the union (Close 2014).
Greece’s economy mainly relies on the service sector, which accounts for more than 80% of the country’s economic revenue (Close 2014). The huge contribution of tourism and shipping industries explain the country’s reliance on the service sector. About 16% of the economy is industry-based. Agriculture contributes a paltry 3% of the country’s economic output (Close 2014). Within the Balkans region, Greece is a significant investor and a powerful economic force (Close 2014). Since joining the E.U, in the 1980s, Greece uses the Euro as the country’s main currency.
The U.A.E
The U.A.E economy is among the largest economies in the Arab world (it is second to Saudi Arabia). The country’s GDP is $570 billion (Mallakh 2014). Although it primarily depends on the energy sector as its key revenue earner, recent diversification efforts have improved the contribution of the non-oil sector to more than 70% of the country’s G.D.P (The Global Economy 2015). By virtue of being part of the G.C.C, the UAE economy is the most diversified in the Arab world. Diversification mostly characterizes one emirate – Dubai. Other jurisdictions have adopted a conservative approach to this strategy (Mallakh 2014).
For example, Abu Dhabi (the country’s capital) still mainly relies on oil revenue (Mallakh 2014). Consequently, more than 76% of the country’s budget financing comes from the energy sector (The Global Economy 2015). Besides the vibrant oil sector, tourism is a major income earner in the UAE. Furthermore, the real estate and construction industries contribute to UAE’s economic growth (experts estimate that there are about $350 billion worth of ongoing construction projects in the UAE) (Mallakh 2014). The service sector also plays a secondary role in improving the U.A.E’s economic fortunes.
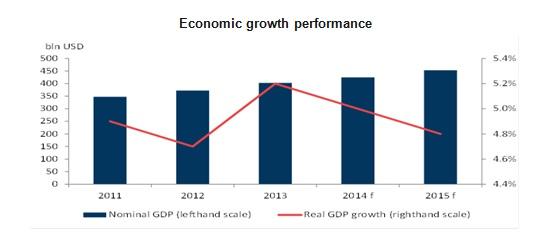
This sector has accounted for tremendous economic growth in the past five decades. Broadly, experts say since 1971, the economy has grown more than 200 times (The Global Economy 2015). As mentioned in this report, the discovery of oil contributed to most of this growth. Comparatively, the non-oil sector has grown by about 28 times since the early 1980s to 2012 (The Global Economy 2015). The country’s diversification policy is the main reason for the U.A.E’s impressive economic growth. For example, in 2014, the economy expanded by 5% because of the country’s diversification policy (The Global Economy 2015). According to the diagram below, the country’s G.D.P has been on an upward trajectory
Germany
The German economy is among the biggest economies in the world. The United States (U.S), China, and Japan are the only economies that rank higher than Germany (in terms of economic size) (Owen-Smith 2012). It has the fourth largest nominal G.D.P, globally (Owen-Smith 2012). It is also the biggest national economy in Europe and primarily relies on a social market economic policy. It is also heavily dependent on the export sector, with cars and pharmaceuticals being its primary export commodities (Owen-Smith 2012). The vibrancy of this sector has created a budget surplus of $282 billion in the country (The Global Economy 2015).
By virtue of being the biggest capital exporter in the world (and the third largest exporter in the world), Germany receives more than $1.5 trillion in revenue from its export businesses (The Global Economy 2015). In terms of G.D.P contribution, the service sector contributes more than 70% of the country’s output (Owen-Smith 2012). Industry and agriculture contribute the rest of the country’s G.D.P. Since the unification of East and West Germany, the country has had a steady population of 80 million people (The Global Economy 2015). Although this figure is on the decline, the German economy has remained steadfast.
This observation appears on the graph below.
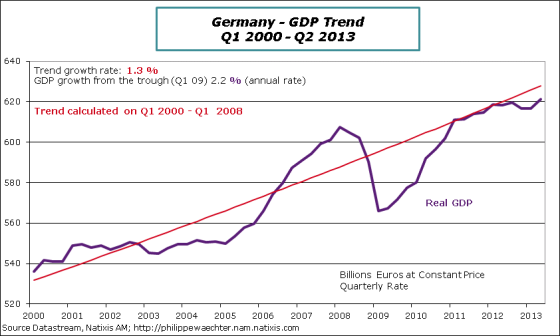
Based on the above graph, the G.D.P growth rate in Germany has been on an upward trend, until the 2007/2008 economic crisis, which caused a sharp decline of this metric. However, since the global economic recovery started in 2009, the country has reported increased G.D.P growth (Waechter 2013).
Similarities and Differences among the Three Economies
Similarities
Greece and Germany are both members of the E.U. They use the Euro as the main currency. Unlike Greece, the UAE and Germany both have a positive current account balance. Germany’s current account balance is $239 billion (The Global Economy 2015). Comparatively, the UAE has a positive current account balance of $66.6 billion. Greece has a negative current account balance of 1.1 trillion (The Global Economy 2015). The service industry is also a significant G.D.P contributor in all the three nations. Although Greece leads the pack in this regard, the U.A.E and German economies also depend on their service industries for economic prosperity. Economic growth is another similarity that defines the three economies. The diagram shows this phenomenon
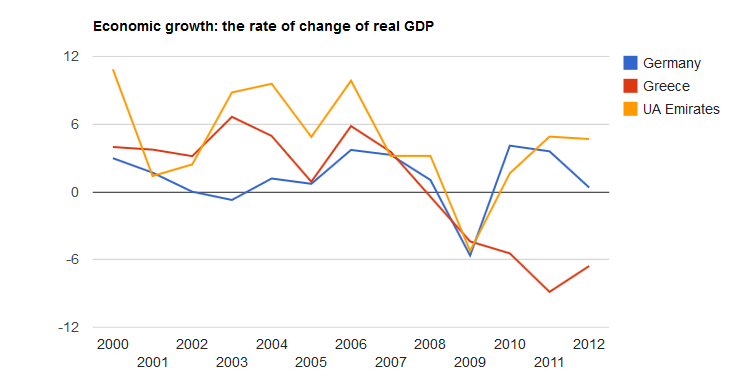
An overview of the above graph shows that the three economies have the same trend, in terms of economic growth. For example, the economic growth rates of the three economies plummeted during the 2007/2008 economic crisis. However, the U.A.E and Germany have done a better job of recovering from it.
Differences
The German economy is by far the biggest economy compared to the U.A.E and Greece. A comparison of the U.A.E and Germany shows that the latter is nine times bigger than the U.A.E economy (in terms of G.D.P). A graphical representation of this comparison appears below
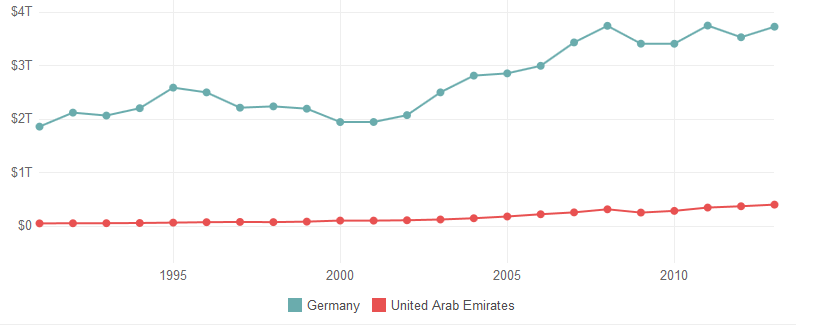
The difference, in terms of G.D.P, per capita, for both countries, is relatively small (compared to their national G.D.P differences). Germany has a G.D.P per capita of $46,268, while the U.A.E has a G.D.P per capita of $43,048 (The Global Economy 2015). Germany still fares better in this regard.
Germany and the U.A.E both have low unemployment rates of 5% and 3%, respectively, but Greece’s unemployment rate is more than 21% (The Global Economy 2015). This problem stems from the country’s debt problem. The graph below shows a comparison of the unemployment rates in the three countries
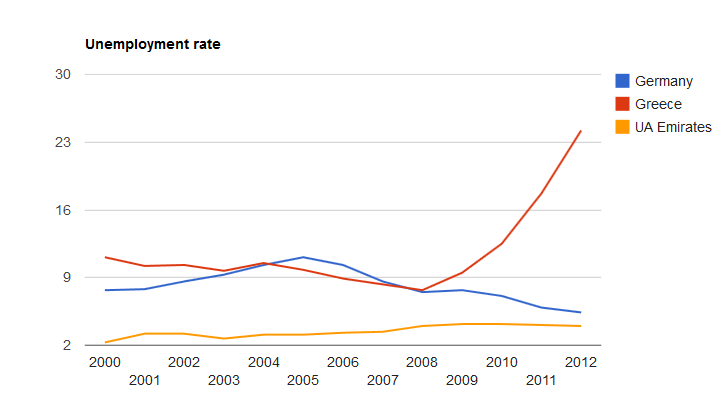
Based on the above diagram, Germany offers more job opportunities to its citizens than Greece. Although the U.A.E has a relatively lower unemployment rate than Germany, the European nation has done a better job of reducing its unemployment rate after the 2007/2008 economic crisis. Comparatively, Greece’s unemployment rate has soared after the crisis. It is the highest in Europe (Close 2014). Not only does Germany have low unemployment rates, it is a lucrative destination for investment because it has a higher worker output per capita, than both Greece and the U.A.E combined (Close 2014).
Comparatively, Greece’s economic output per person is lower than Germany because it pays its workers high wages for little output, thereby making it a less attractive investment destination compared to its peers (Close 2014). In fact, its G.D.P per capita is like most less developed countries. This is why, over the years, Germany has increased its wealth, while Greece has decreased its wealth.
While Germany may fare better than Greece and the U.A.E in terms of economic performance, it is important to understand that population size is usually directly proportional to the economic potential of a country (Mallakh 2014). Compared to Greece and the U.A.E, Germany has a significantly higher population (more than 80 million people). Comparatively, Greece has a population of 11 million people, while the U.A.E has a population of 9 million people (Mallakh 2014). These figures show that Germany’s population is ten times higher than both countries. This statistic partly explains Germany’s big economic size.
The U.A.E economy differs from that of Germany and Greece because it is primarily dependent on the oil sector. Comparatively, the Greek economy is dependent on the service sector, while the German economy is dependent on the manufacturing sector. An assessment of the G.D.P growth rates across both countries also shows that the Greek economy performs poorly than both Germany and the U.A.E.
Economic Futures
Unemployment
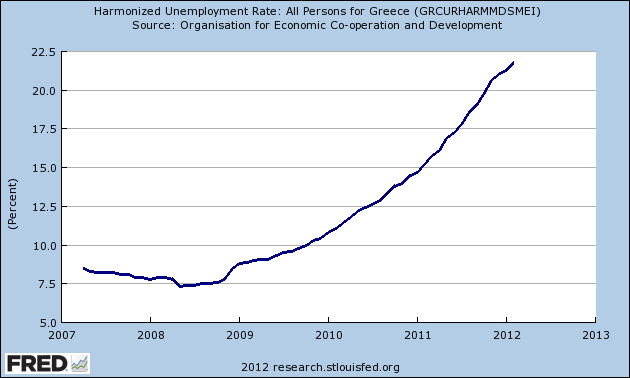
Seven years into the debt crisis, Greece has not improved its economic performance. Although it was at par with America (in terms of unemployment and G.D.P growth) during the 2007/2008 economic crisis, the latter has made tremendous strides in improving its economic performance (The Global Economy 2015). Greece still lags behind in this regard (see Figure 1). It is still early to predict the future of Greece’s economy because the country’s debt burden is still high ($360 billion) (Close 2014). This burden paints a gloomy picture of the country’s potential to improve its economic fortunes. The government’s budget cuts do not help in improving the economic performance of the country either because they are bound to slow the economy. The unemployment problem in Greece is likely to worsen because the country’s population of unemployed youth is at an all-time high. This bleak picture comes from the fact that unemployment at a young age tends to stifle the prospects for improved wages and employment opportunities in the future (Close 2014). Nonetheless, unlike the U.A.E both Greece and Germany are suffering declines in population growth. This is a concern because it is unclear how both economies will power future economic growth.
Current Account Balances
Although Greece continues to suffer from a negative current account balance, ongoing efforts to revive the economy should improve this index. The growth of the U.A.E non-oil sector is also likely to improve the country’s current account balance in the same way. In fact, based on the graph below, the U.A.E is likely to have a more positive current account outlook than both Germany and Greece combined.
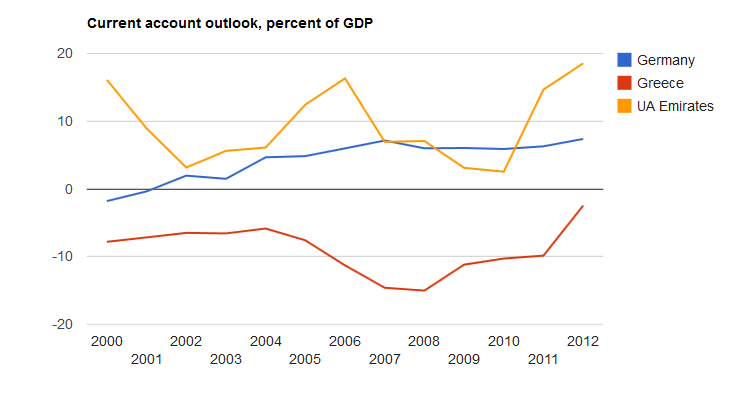
Nonetheless, Germany will continue to tower over Greece and the U.A.E, in terms of realizing the benefits of a positive balance of payment because of its innovative culture and competitiveness. Indeed, the European nation is a fundamentally stronger economy than both the U.A.E and Greece combined (The Global Economy 2015). The U.A.E’s main export is oil, but this resource is slowly dwindling. Comparatively, Germany’s diversified exports are likely to grow and further improve its balance of payment. Comparatively, Greece’s competitiveness is low because of high wages.
Therefore, it is likely to continue suffering from low exports and a negative balance of payment. Greece has only one major export – tourism. However, this resource may decline because of increased competition with other tourism destinations in Europe (especially because it is part of the E.U). This concern explains why some observers propose that Greece should leave the E.U to improve its tourism exports (Close 2014). If it does so, it would revert its national currency to the drachma, which would be cheaper than the Euro and attract more tourists.
G.D.P
The U.A.E and German G.D.Ps are likely to improve in later years because both countries do not have outstanding tax debts as Greece does. Particularly, the performance of the U.A.E economy is likely to improve on the back of the energy sector and the non-oil sector. The country’s diversification strategy should spur this growth as it diverts attention from the energy sector to other economic sectors that have similarly high potential for growth. Therefore, the country’s business environment should improve on the back of an increasingly transparent economic environment that is likely to improve investor confidence because of minimal operation risks.
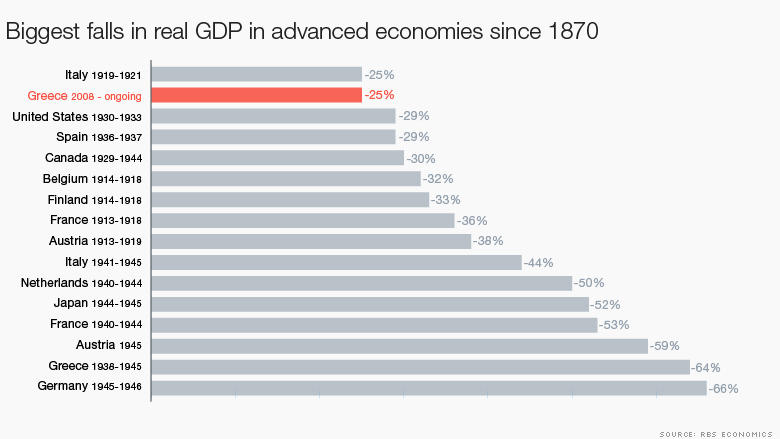
It is difficult to transfer the same optimism to Greece because it has had a problem of taxpayers remitting their returns to the government, thereby undermining the government’s efforts of paying its debts and reviving the economy (Close 2014). This difference not only explains possible reasons why both the U.A.E and Germany could scale to greater heights of G.D.P growth, but also contrasts the outcomes of disciplined and “extravagant” governments. Germany also has higher technological prowess than Greece does (Owen-Smith 2012). The U.A.E’s efforts to embrace new technology also give it the same economic advantage as Germany. Comparatively, Greece’s technological advantage has continued to decline in the wake of a slow economy. It is an example of how a wealthy nation could slip back in the path of economic progress. In fact, its G.D.P decline is among the greatest in history (see Figure 2).
Summary
This paper has shown that Greece, Germany and the U.A.E are dominant economies in Europe and the Middle East. Although they have achieved significant levels of success in this regard, they have few similarities. Besides being members of regional economic blocs (such as the E.U and G.C.C) and relying on a few economic sectors for growth, this paper found many differences among the three economies. Therefore, they account for their varying economic differences. Germany emerged as the most dominant economy among the three countries sampled. Its current and future economic prospects are also promising because of strong economic fundamentals, such as a strong regional competitiveness, low unemployment rates and a large global market share for its goods and services.
The U.A.E also shares similar economic prospects because of its diversification policy. However, its current reliance on the oil sector continues to plague the country’s future economic outlook because, although it may support budget needs in the short-term, it is untenable to depend on the energy sector at the end. Comparatively, Greece has much more work to do to improve its current and future economic prospects because of its debt burden. Particularly, the country has to look for better ways to improve its tourist numbers because the economy remains heavily service-dependent. Collectively, these dynamics show that the three economies have different economic characteristics.
References
Close, D 2014, Greece Since 1945: Politics, Economy and Society, Routledge, London. Web.
Mallakh, R 2014, The Economic Development of the United Arab Emirates (RLE Economy of Middle East), Routledge, London. Web.
Owen-Smith, E 2012, The German Economy, Routledge, London. Web.
The Global Economy 2015, Comparator.
Waechter, P 2013, GDP Dynamics in the Euro Area.
Zawya 2014, UAE economy growing stronger: with support of an effective diversification policy.Web.