About the Economies
The UAE
The UAE was established in 1972 after the merger of six states. The UAE has a vibrant economy. Its performance can be compared to nations in the European region. The country heavily depends on the production and sale of oil, other oil equivalent products, and global investment. Also, it has reported a steady growth of economic performance since its formation. Political stability has been experienced in the country over a long period. This can be attributed to measures that have been put in place by the government to ensure that the environment is suitable for development. For instance, the government has ensured that the Arab Spring unrest is not experienced in the country (Central Intelligence Agency 2015b).
The UAE is an open economy that is characterized by high per capita income and trade surplus. In recent years, the government of the UAE has been keen on diversifying economic activities. This is based on the fact that the economy depends on the production of oil and gas production. Thus, the government seeks to reduce the income generated from oil production to 25%. Further, the government is keen on improving infrastructure and creating jobs. To achieve this, the country has put in place measures such as zero tax rate and a free trade zone with the aim of attracting foreign investors. The UAE was hit by the global financial crisis because of its dependence on the production of oil.
The government responded to the meltdown by growing expenditure and improving the liquidity of the financial institution. The UAE is a member of the Gulf Corporation Council (GCC). When compared with other GCC members, the country has the second-largest economy after Saudi Arabia. Further, it has the most diversified economy with a highly developed infrastructure (Central Intelligence Agency 2015b).
India
India is not a fully open economy as compared to the UAE. The country is gradually moving from a closed economy to an open economy. In earlier years, the country operated as a self-sufficient nation. It did not engage in external trade. However, the economy was liberalized in 1997. Some of the liberalization measures that were put in place are the minimization of barriers to trade, privatization, and deregulation of industries. These measures sparked economic growth between 1997 and 2011. The economy of India is quite diverse. It depends on a number of activities ranging from agriculture, service industry, and handicrafts.
Further, the country highly depends on the service sector for economic growth and development. The country is also endowed with a large population of highly educated citizens. Therefore, it has become a key exporter of outsourcing and technology services. From the year 2011, the country reported a decline in performance. This can be attributed to a number of factors such as growth in inflation, less investment, and a lack of state commitment to respond to the global changes in the economy (Central Intelligence Agency 2015a). The country also faces a number of problems that have persisted from one decade to another. Examples of such problems are poverty, inefficient and inadequate generation of power, and corruption, among other problems. The country is ranked fourth and one hundred and sixty in the world based on the Gross domestic product (GDP) and GDP per capita, respectively (Central Intelligence Agency 2015a).
Variables
The selection of variables will be based on the existing economic models. Such models usually depict the relationship between two or more economic variables. An example of a model that will be used is the macroeconomic identity. The model is presented below.
Y = C +I + G + (X – M)
Where;
- Y = GDP or national income
- C = Consumption expenditure
- I = investment expenditure
- G = Government spending
- X = Exports
- M = Imports
Apart from the variables in this model, the others that will be analysed are saving, inflation, unemployment rate, and population.
Data
The table presented below shows the data for the two countries.
(Source of data – International Monetary Fund 2015; The World Bank Data 2015)
Discussion
Components of Aggregate Demand
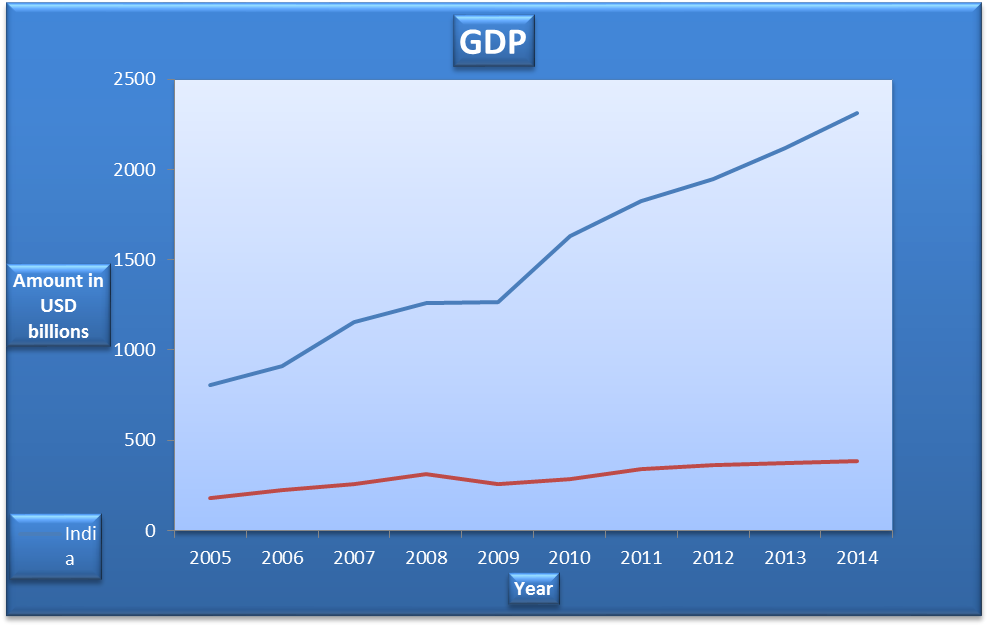
GDP
The GDP of the two countries rose during the ten-year period. The GDP for India grew from USD808.744 billion in 2005 to USD2,314.715 billion in 2014, an increase of 186.21% (The World Bank Data 2015). In the case of the UAE, the value rose from USD180.617 billion in 2005 to USD387.225 billion in 2014, an equivalent of 114.39% (International Monetary Fund 2015). It can be noted that the overall growth in India was higher than in the UAE. Besides, the level of GDP in India is higher than in the UAE. Further, in 2009, the UAE had a drop in GDP. This can be attributed to the global financial crisis. In the case of India, there was no drop in the value of GDP.
However, the country experienced slow growth in the value of GDP in 2009. The trend of the values shows that the countries were able to recover at a faster rate from the crisis. In the case of GDP per capita, the countries reported growth over the years. The value of GDP per capita had a similar trend as GDP. However, the UAE had a high value of GDP per capita than India. This shows that the standard of living in the UAE is higher than in India. Even though the global financial crisis had adverse ramifications of international trade with a disproportionate impact on the economies of the UAE and India, there were a lot of positive developments happening in the two countries. Further, it is expected that the value of GDP and GDP per capita will improve in the coming years.
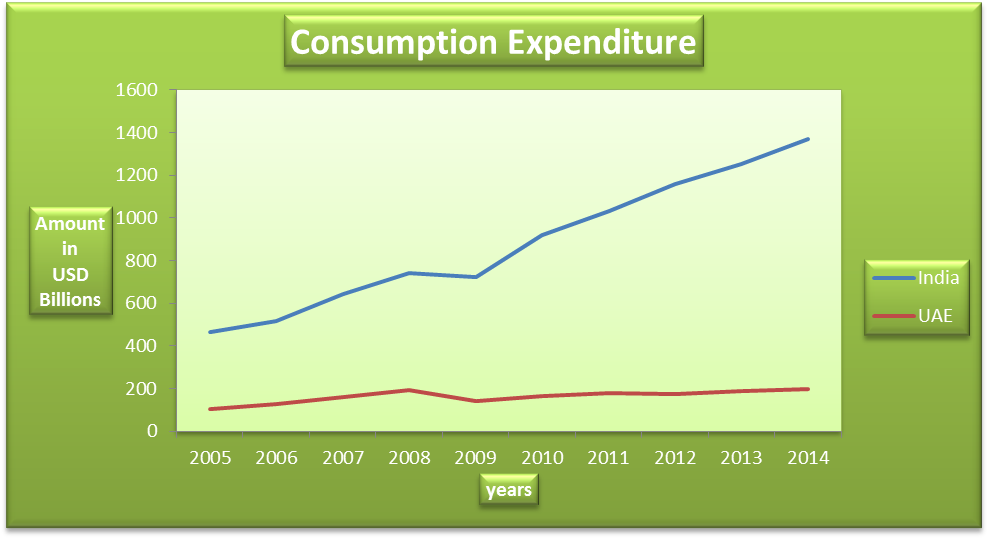
Consumption Expenditure
The household final consumption expenditure, measured as a percentage of GDP, comprises all goods and services bought by households. The value excluded the purchase of residential houses. In most economies, the consumption expenditure accounts for about 50% to 80% of the gross domestic product. In India, the consumption expenditure accounted for between 55.69% and 59.45% of GDP, while in the UAE, the range was between 48.07% and 61.34%. Further, it can be noted that the consumption expenditure as a percentage of GDP for India was fairly stable while that of the UAE declined. This implies that the over-reliance of the economy on oil dropped. The consumption expenditure in both countries accounts for more than half of the GDP. Also, there was a growth in consumption expenditure in both countries. The percentages show that consumer demand has a strong influence on the economic growth and development of both countries.
Development of both countries.
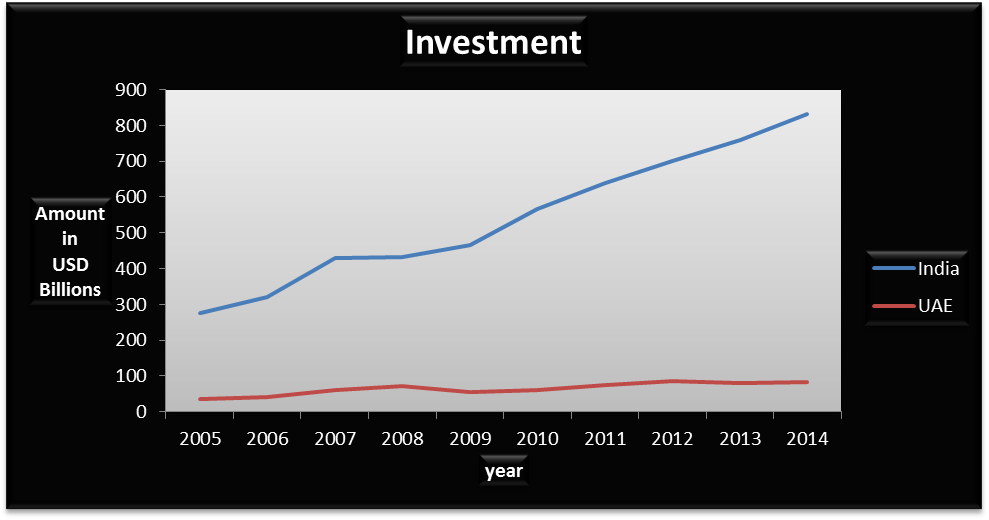
IInvestment Expenditure
This category gives information on the amount spent by the private sector on investment. In India, the value of this investment grew over the period. The total increase over the ten-year period was 201.45%. The percentage of investment GDP in this country remained fairly constant. The range of this value was between 34.138% and 37.357%. Thus, the growth of investment can be attributed to GDP growth. In the case of the UAE, investment grew by 136.67% during the entire period. The range of the proportion of investment to GDP was from 18.215 to 23.78. In both countries, it can be observed that investment dropped during the global financial crisis. Further, the expenditure on investment in India was higher than in the UAE. Further, the high proportions of investment to GDP can be an indication that the two countries are suitable for investment.
Government Spending
In the case of India, this expenditure grew by 197.07% during the entire period. On average, government spending contributes to about 27% of India’s GDP. In the case of the UAE, government spending grew by 220.90% over the ten-year period. In both countries, there was significant growth in government spending after the global financial crisis. This can be attributed to the fact that it is an expansionary fiscal policy tool used by various governments to stimulate the economy. Specifically, this tool cancels a reduction in consumer expenditure and investment, thus stabilizing the economy and increases GDP.
Imports and Exports
The final component of the aggregate demand equation is net exports, that is, the difference between the export and imports. In the case of India, the volume of imports and exports grew during the period. Further, the volume of imports of goods and services exceeded exports during the entire period. This implies that the country had negative net exports. Thus, the balance of trade contributed negatively to the GDP of the country. In the case of the UAE, the volume of imports and exports grew during the period. Further, exports exceeded imports. This shows that the country had a trade surplus. Further, it can be observed net exports grew from $28billion in 2005 to $80.26 billion in 2014. The contribution of the trade surplus to GDP grew from 15% in 2005 to 20% in 2014. Thus, the trade balance from the two countries shows that the UAE gained from international trade because of the production of oil, while India makes losses from international trade.
Others
Saving
All the components of aggregate demand function are exhausted in the previous section. Saving is a component of aggregate supply. This variable is of importance because the saving-investment balance is closely related to the trading balance. In the case of India, the saving-investment balance was negative, just like the case of net exports. Therefore, the country is likely to experience a capital inflow to enable India to buy foreign commodities. In the case of the UAE, the saving-investment balance was positive, as observed in the case of a trade surplus. Thus, the country will experience capital outflow to enable foreigners to purchase more of their commodities. During the global recession, there was a significant drop in saving-investment balance. This had an impact on consumer purchasing power.
Inflation
Inflation, as measured by the gross domestic product deflator and average consumer prices, grew during the period in the two countries. The inflation rate in India grew at a faster rate than in the UAE. However, the UAE has a higher level of inflation than India.
Unemployment rate
The unemployment rate is an important variable that should be analyzed in an economy. A high unemployment rate can slow down the rate of economic growth. The two countries seem to have an equal level of the unemployment rate. However, the data show that unemployment in India dropped during the period. The country experienced slight growth during the global financial crisis. In the case of the UAE, the unemployment rate rose by a larger margin than India during the global financial crisis. Further, it can be noted that the unemployment rate in the UAE took a much longer time to fall after the crisis. An increase in the unemployment rate can be attributed to a reduction in economic activities within a country. Thus, a country with a high unemployment rate is likely to have a low value of GDP.
Population
India has a higher population than the UAE. The population of India is more than 270 times that of the UAE. The population and its composition are significant variables in a country because they have a possibility of affecting GDP, GDP per capita, labor force, and government spending, among other variables. For instance, the data in the table above shows that India has a higher amount of GDP than the UAE. However, the population of India is higher than that of the UAE. Thus, the resulting GDP per capita of India is quite lower than that of the UAE. Further, it is important to evaluate the proportion of the labor force that is actively involved in economic activities.
In summary, the discussion above shows that the overall performance of India’s economy is higher than that of the UAE. Further, India depends on the service industry, while the UAE heavily depends on oil. Also, there has been a growth of performance in the two economies, and the trend is expected to persist in the future. Both countries experienced a slowdown in performance during the financial crisis, and they both recovered from this crisis.
References
Central Intelligence Agency 2015a, The world factbook: India.
Central Intelligence Agency 2015b, The world factbook: united arab emirates. Web.
International Monetary Fund 2015, World economic outlook database. Web.
The World Bank Data 2015, World development indicators. Web.