Market Capitalization
Market capitalization indicates the size and performance of the company, and it also reflects how the management responsible for the changes in external economic environments by allocating funds on equity and liability reasonably. In the case of the GCFB Company, the market capitalization has been on the downward trend with the worst decline being recorded in the year 2014 after which it began to rise again, In the year 2011 the market capitalization was at 17.98 million and it declined to 17.62 million dollars in the year 2012. The market capitalization further declined to 17.31 million in the year 2013 after which it plunged to 9.326 million in the year 2014.
Apparently, the rapid drop in the year 2014 resulted in reduced market capitalization by almost 6 million dollars. The sudden plunge can be attributed to the decrease in the stock price in the same year. Besides, the sudden plummet of the market capitalization in the 2014 financial year shows that the GCFB’s executives failed to diversify its portfolio well to avoid the investment risk. Fortunately, improvement is observed from the price as well as total market share value started to increase after 2014 even GCFB bought back $0.2 million shares in September 2015.
The rise in the market capitalization was by almost three million dollars from the dismal performance of 9.326 million to 12.46 million dollars in the year 2015. Apparently, the rise in the market capitalization in the year 2015 can be attributed to an increase in investment diversification and the establishment of cost management strategies by the executives of the GCFB. The market capitalization for the GCFB Company for the last five years, which is from the year 2011 to 2015, is summarized in table 1 below.
Table 1: Market capitalization for the GCFB for the last five years.
From the above table, the following graph was generated to show the trend in the growth of the market capitalization for the GCFB Company from the year 2011 to the year 2015.
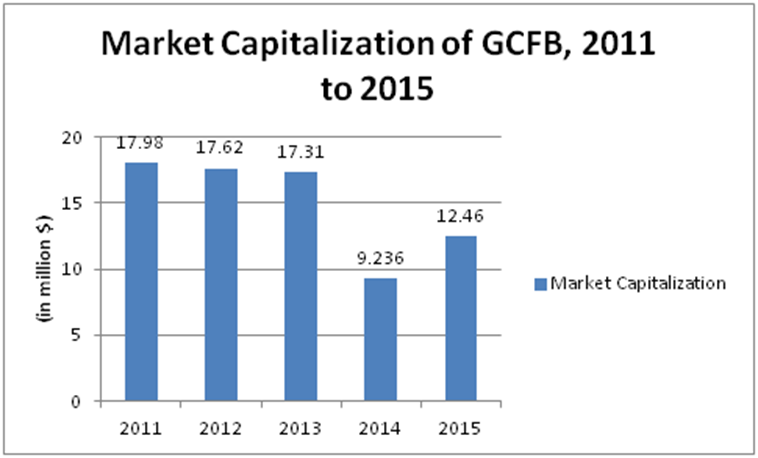
From table 1 above, there was a general decline in the market capitalization for the GCFB Company from the year 2011 t0 2013 by a relatively small margin ranging from 310,000 dollars to 980,000 dollars. There was a sudden and a big plunge in market capitalization by almost 6 million dollars in the year 2014. This was followed by a rise to 12.46 million dollars.
In terms of percentages, the growth and decline in market capitalization for the GCFB Company are summarized in table 2 below.
The percentage decline in the market capitalization for the GCFB Company was recorded at 1.509, 2.32, and 48.53 for the year 2012, 2013, and 2014 respectively. However, although still a decline as compared to the year 2011, there was a rise in percentage growth in the market capitalization in the year 2015 by 29.67%. This is an indication of declining market capitalization for the last four years with a steady rise in the year 2015.
Comparative Analysis to Primary Competitors
The market capitalization trend for the GCFB stock price has been in the decreasing trend since the year 2011 and only begun to recover in the year 2015. In comparison to its primary competitor, the historical stock price of Red Robin’s from 2011 to 2016; it is obvious to see that the overall stock price of GCFB is lower than Red Robin’s, and contains more fickle fluctuation as summarized in figure 1 and 2 below.
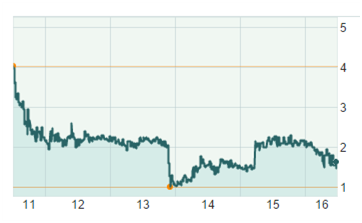
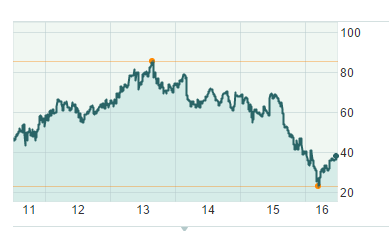
Apparently, from figures 1 and 2, the market capitalization for the GCFB is increasing at a lower percentage as compared to its primary competitor, Red Robin. This is an indication that the corporate strategy for the last five years has been less effective.
Market Capitalization as a Ratio to Sales
Table 3: Market capitalization as a ratio of sales for the GCFB and its primary competitors.
From table 3 above, their market capitalization as a ratio of sales was higher at Red Robin and Denny’s than at the GCFB for the last five years. Interestingly, the Red Robin had the highest market capitalization as a ratio of sales probably due to the diversification of products and rapid market expansion. The lower market capitalization as a ratio of sales at the GCFB can be attributed to limited diversification of products and store chain expansion.
The ROI, ROE, ROIC, and EPS of the GCFB Company
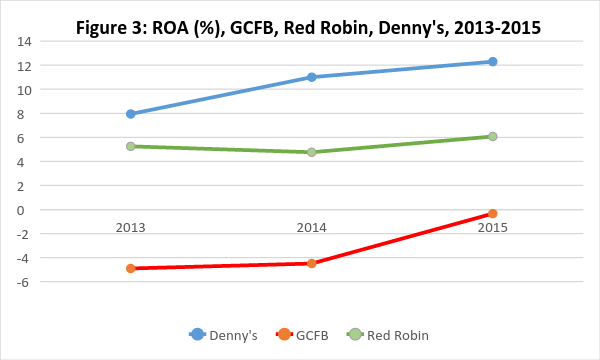
The Return on Asset (ROA) figure indicates how effectively the leaders to convert the funds it has to invest in assets. Figure 3 shows the ROA of GCFB, Denny’s, and Red Robin from 2013 to 2015. The ROA of GCFB proves that the executives of GCFB should make wise choices in allocating its resources on assets properly as it is negative and pretty lower than its key competitors. Fortunately, the increasing trend of GCFB’s ROA observed from Figure 3 also indicates that the executives already recognized the problem and had started to change the condition by reducing the purchase of new assets and focusing on increasing its revenue.
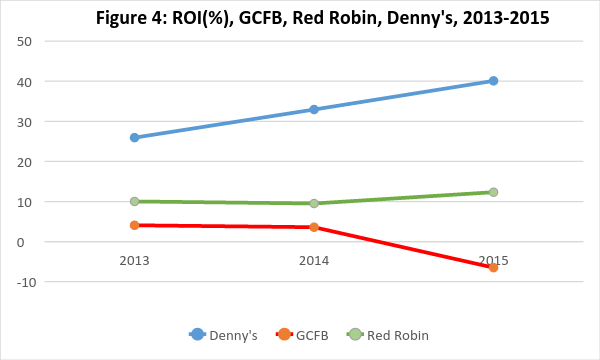
Return on Investment (ROI) measures the efficiency of an investment and based on the movements of ROI of GCFB and its major competitors that shows in Figure 4, in the past three years, these negative ROIs of GCFB are always lower than its competitors’ and in 2014, it starts to appear a decreasing trend. Therefore, the ROIs of GCFB prove that the executives of GCFB failed to invest properly and still couldn’t find an efficient solution to solve that.
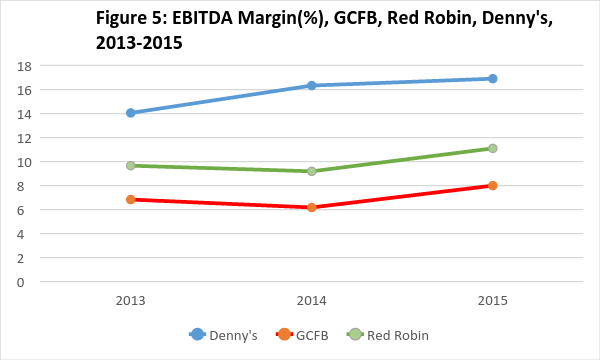
EBITDA margin equals earnings before interest, tax, depreciation, and amortization divided by total revenue which directly shows an investor a clear view of operating profitability and a higher EBITDA margin can allow a corporation to attract more potential investors. The management of GCFB’s does bring profits to their respective firm, but it couldn’t’ bring a competitive advantage to GCFB. The reason is that in Figure 6, it represents the comparison of EBITDA margins of GCFB and its competitors from 2013 to 2015, and it shows that even the EBITDA margins of GCFB in the past three years are all positive, but they are still lower than the EBITDA margins of Red Robin and Denny’s during the same years.
In summary, although the top leaders of GCFB have rich professional knowledge, intensive experience, and do bring profits to this firm, the above analysis indicates that negative returns come from a poorly diversified portfolio and improper investment decision as to the problem as well as weakness of GCFB, which translates into inefficient management. This problem was proven by the ratios mentioned before such as ROI, ROA, and EBITDA margins of GCFB, which are lower than its competitors.
Therefore, there is no competitive advantage in this function for the GCFB. This means that the company does not enjoy any competitive advantage over the Red Robin and Denny’s when all other factors are held constant. Besides, it indicates that the company’s current competitive advantage strategies are not effective in ensuring that the GCFB’s market is suitable for sustainable business in the face of stiff competition. In addition, the weak competitive advantage position observed at the GCFB may be an indication for an immediate need to reorganize the firm’s management strategies in order to create efficient outcomes for short and long-term gains in the competitive and dynamic market.
Current Corporate Strategies at the GCFB
Vertical Location in Value Chain System
The GCFB Company’s primary value chain core business is the restaurant and on-site brewery, which generate the largest percentage of revenues. The restaurant value chain is organized into 34 branches that are spread across the US with each branch having an on-site brewery. The brewery is the favorite of many customers since they can customize their drinks before manufacture and have a relatively lower waiting time per service.
The company’s on-site brewery has been very successful and the main factor that has influenced its current expansionary strategy. Since the conception of this type of product, the revenues from the on-site brewery has grown from less than 20% of the total sales to 60% of the sales at present. The GCFB is located in both the midstream and downstream. The location in the midstream is informed by the fact that it manufactures different types of alcohol brands on-site and does distribution, especially on special orders. For instance, the Minnesota branch has a well-developed distribution network to service clients who make orders but cannot create time to collect the products.
In terms of the downstream characterization, the GCFB Company has been proactive in retailing different products in the form of fresh food menus and alcohol brands through its restaurant business model. In each of the 34 branches, the business of the company is organized into a retail store where customers can order for a variety of fresh menus, which take less than 20 minutes to be ready. Besides, a customer may make a special order on different brands on alcohol depending on taste and price range. These products are retailed within the restaurant. The value chain for the company is summarized in figure 4 below.
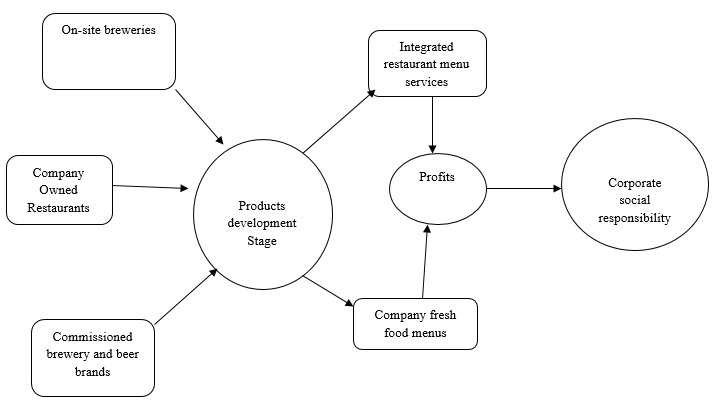
The value chain of the GCFB is one of the most organized in the industry since each product and customer segment is arranged in a unilateral manner to ensure easy flow of the business activities. The restaurant services and the on-site brewery in each branch have been customized to meet the demands of potential customers. For instance, a customer who wants exotic fresh food will simply peruse different menus and make their order.
The customer may also proceed to make an order for a preferred alcohol brand from varieties that are retailed by the company. By the time the ordered food is served, the alcohol is also ready and maybe served on-site or packed, depending on the customer’s preference.
Horizontally in Business Ownership
The GCFB Company owns two types of businesses that are housed in 34 branches across the US. From its headquarters in Minnesota, the restaurant cum on-site brewery business model has been expanded to cover the other 33 regions. Under the restaurant business, the GCFB has created more than 500 different menus from local fresh food products that the locals can easily associate with. These menus are designed in a way that they can be further customized by clients to meet their demands. Most of the menus within the GCFB restaurants are very common and preferred among the locals.
The company has gone a step further to introduce the aspect of healthy balancing of different menus as part of its optimal quality service management. Under the on-site brewery business, the GCFB has created a dynamic, simple, but very effective beer and winemaking venture that has been very successful among customers. Unlike the traditional business that retails already distilled and packed alcohol, the GCFB has created a customizable brewery where customers can make orders and watch as their beer is being made, distilled, and packed. Besides, customers are presented with the opportunity to choose from a wide variety of different local and exotic beer brands, depending on their taste and price tag.
These two business forms have given the GCFB the necessary platform for penetration into the US market and establishment of a stable brand that is easily recognizable. Since the GCFB own two types of business that are housed in 34 branches across the US, there are two NAICS classifications, which are food and beverage. Under food, there are several fresh menus available at the company. Under beverage classification, there are many brands of alcohol and wine brands that are available.
The synergies within the value chain of the restaurant cum brewery business model at the GCFB are the integration of different products into a single service venture. For instance, the company has maximized the space available to run the two businesses concurrently. Within the restaurant, there is an extension in the back, which serves as a brewery. This means that a customer can order food and beer at the same time and consumer the two products while sited in one spot. Through this approach, the company has been able to save on space and costs related to running two businesses from different locations. The restaurant cum brewery model has been very critical in influencing increased revenue’s ability to customize the food and alcohol products have become an attraction to clients.
Geographic Diversification
The home state of the GCFB business is located in Minnesota, within Granite City. The company operates in 14 states across the US besides Minnesota. The home market of the company is the US and there are current plans to expand into Canada and beyond. However, the firm has not entered into other markets outside the US. The GCFB currently has 33 branches beside the Granite City headquarters.
The GCFB Company has adopted the national and multi-domestic business strategies to penetrate the local Minnesota market and other 13 states within the US. Under the multi-domestic strategy, the products retailed by the company are drawn from local menus to appeal to the local market. The national strategy has been adopted to create different branches to meet the ever-growing demand for the GCFB brand. The mode of entry adopted by the GCFB was through a strategic alliance with different suppliers, especially the aspects of the business that are outsourced. For instance, the GCFB depends on the strategic alliance to get exotic menus from external suppliers and raw materials it uses to brew its different brands of alcohol.
Through the strategic alliance, the company has been able to limit risks from the external market forces such as the cost of raw materials since the GCFB has signed a binding contract with the suppliers.
Current Problems/Issues with the GCFB Corporate Strategies
The main challenge facing the current strategic alliance adopted by the GCFB to facilitate market entry and penetration into the US food and beverage industry is the inability to balance the supplier forces, which is very strong. The company has to deal with the constant cancelation of contracts or delays in the delivery of different raw materials since the GCFB relies on the complex logistics outsourcing and benchmarking of the entire supply chain.
This means that the production and operations of the company are not optimal at the moment since the suppliers are sometimes unable to deliver raw materials within the set deadline. Although the outsourced aspect of production is delivered eventually, any delays attract most costs on the general efficiency of the entire production matrix. For instance, in the year 2014, the instability in the food industry resulted in a massive reduction in the company’s market capitalization since there was an increase in the cost of obtaining several raw materials. The company had to absorb the increased cost since an otherwise decision would have led to a massive delay in raw material delivery.
Since the company depends on the outsourced suppliers to complete each production cycle, the GFCB is currently grappling with the challenge of sustaining a competitive advantage in prices it charges for final products, despite swings in the cost of the raw materials. For instance, even when there is an increase in the cost of obtaining raw materials, the company cannot increase its prices by the same margin since other competitors will surpass the GFCB’s current competitive prices. This means that the GCFB has to accept reduced revenues whenever supplier forces become illuminated beyond the control of the company.
Moreover, the cost of canceling a contract with a supplier might attract the risk of court cases that are characterized by hefty fines. In addition, the company has to constantly worry about the quality of production because it is very expensive to verify the bulky raw materials each time they are delivered. By excessively depending on strategic alliance partnerships to manage the supply chain, the GCFB is currently facing the risk of losses and changed market preference if the quality is compromised.
Strategy Recommendations and Rationale to Address the Problem of Strategic
From the above analysis, it is apparent that the GFCB Company has a strong presence in the US due to its product diversification and competitive pricing. The company’s unique on-site brewery has attracted many customers and is the current force propelling further expansion and establishment of more branches. Besides, the company has successfully exploited the benefits from economies of scale to reduce different costs that are associated with economic and expansionary risks. Within the US food and beverage industry, the company has one of the most recognizable logos and a dynamic workforce that has spurred its current expansion strategies.
However, the company is facing challenges within its strategic alliance approach towards market penetration within the US and beyond. The challenge is a result of market swings and excessive power of suppliers in the industry. The GCFB Company has a great opportunity to overcome this challenge since it operates in an environment where branding and customer preference determines the success of a venture.
This means that the company may decide to adopt a turn-around strategy to convert the current challenge of a strategic alliance with the supplier into a competitive advantage generator. Therefore, the GCFB Company should consider the following strategies to overcome the current challenge of the inability to balance supplier forces in executing a strategic alliance as a market penetration strategy.
Cross Franchising
Strategy
Franchising is a model in business management which ensures that several independent business entities share the same trade name. Under this arrangement, the GCFB Company will allow other business ownerships to use the primary business brand name and current operation management strategies to minimize the risks associated with entry into new markets. For instance, in the current plans to enter into the Canadian market, the GCFB Company should consider cross franchising as a strategy for minimizing the risks from business failure in unknown territory.
The GCFB Company may only consider collecting preliminary fees and a percentage of total revenues generated by the companies that are granted permission to use the brand name and other business strategies. Apart from the trade name, the GCFB may consider giving free training to the franchisees besides unlimited advertisement airtime for the different products within the current line. Under cross-platform franchising, the GCFB Company may consider sharing the current business permit licenses with the franchisees for the on-site brewery and fresh menu products to ensure that the potential risks of expansion into the Canadian market are absorbed by a third party.
Through cross franchising, the GCFB Company will be in a position to grow faster without having to pump in more capital in the expansion into other markets. As a matter of fact, when the company adopts franchising as a market entry strategy into the Canadian region, it will not necessarily cover any initial cost of starting up a new branch, especially in the dynamic market that is characterized by the high cost of starting a new business. Moreover, it will cost the GCFB Company less inventory, especially when the franchises are run by a third independent party who will absorb the losses while remitting a percentage of revenues generated.
At present, the current top competitors, that is Red Robin and Denny’s use the cross franchising strategy to penetrate the Canadian and South American markets. This strategy has been successful in the two companies since they have spread the risks associated with business failure in a new market. Therefore, the GCFB Company should consider the cross franchising strategy to increase its current competitiveness within the US and beyond.
This model will enable the company to grow from the current third position into a market leader without having to incur further costs in expansion since the franchisees will absorb these costs and any other risks associated with entry into a new market.
The rationale for the Recommendation
The adoption of cross-platform franchising will enable the GCFB Company to effectively gain a sustainable level of competitive advantage in several ways over its current competitors such as Red Robin. To begin with, the established franchises spread across different regions across the globe will enable the GCFB Company to initiate comprehensive market research that captures the desire of customers across the world.
The findings of such research will enable the parent company to not only develop relevant marketing strategies that appeal to each region but also create a standardized operational model that can be applied by the GCFB and the franchisees. Besides, the GCFB will capture accurate trends that might be instrumental towards entry into markets that do not have interested franchisees. Through this approach, the GCFB will be in a position to sustain and realize its current vision, mission, and goals of strategic market penetration through quality and desirable product management.
Besides, the cross-platform franchising will enable the company to lower the potential imminent risks associated with market failure due to the inability to carry out accurate market research of the targeted market. In addition, the cross-platform franchising will enable the GCFB Company to create a strategic market segmentation plan on the basis of how each cluster of customers perceives the brand. As a result, the company will be in a position to predict the customer reaction and actions towards different products across different regions where the brand will be traded. Therefore, the GFCB Company will be empowered to create ideal packages or product lines that meet the desires of each segment of the targeted market after the expansion.
In addition, cross-platform franchising is significant towards promoting innovation in the company, especially within the marketing and supply chain networks. When properly executed, franchising is likely to result in maximum customer retention as a result of satisfaction with the tested brand that is retailed by the franchisees.
In summary, the GFCB Company should consider adopting the cross-platform franchising as a strategy for exponential market expansion without further strain in the current market capitalization. This is because the company will not take care of starting costs in the regions where the brand is assigned to franchisees. As a result, this strategy will position the GFCB Company on the ideal platform for understanding the market dynamics in different regions, product lines that should be modified, and specific customer needs per market. When properly integrated by the GFCB, the proposed cross-platform franchising will enable the company to increase its current competitive advantage while eliminating the current risks from supplier forces.
Improving Efficiency in the Operational Model to be More Inclusive
The aspect of efficiency in the operational model for the GFCB Company is a clear indicator of the position of the company in resource management, market capitalization growth, and supply chain efficiency. Apparently, the above indicators are currently negatively skewed as indicated in the decline in market capitalization and instability in the supply chain due to excessive supplier forces. This means that the GFCB is not efficient in using its current assets to generate optimal revenues and profits in the last five years. Besides, a well-balanced operation efficiency matrix should be able to show the level of activity at the company, when all other factors are held constant.
Although the level of activity at the GFCB has been relatively steady, despite the plunge in the year 2014, there is a need to improve on the operational efficiency as a strategy for sustaining a competitive advantage in the dynamic market.
Despite the decline in the market capitalization, the company has been expanding with an average of four new restaurants each year. However, the company is currently facing a possible failure due to stiff competition from Red Robin, especially in price competitiveness. Therefore the GFCB should consider applying product concentration, marked development, vertical integration, and retail distribution as strategies for guaranteeing operational efficiency in the short and long-term. These strategies are discussed in this section.
Product Concentration
The GFCB should consider concentrating its products to the US before entering any other region since the current market is very stable with no strict laws that might hinder expansion. This means that the company should delay the current plans of expanding into Canada by diverting the resources that could have been used to enter the 15th state in the US market. In the US, there are very few restrictive laws, especially for local businesses such as the GFCB.
This strategy will facilitate the protection of the GFCB brand by ensuring that the company concentrates on a specific market segment. The objective of this recommendation is to ensure that the company is in a position to introduce appropriate measures in its current operative process to make it a distinct venture in the US food and beverage market. In implementing product concentration, the GFCB should balance the aspect of the target market to ensure that customized product lines are unique to the potential customers.
The success of the proposal can be measured by tracking the rise in revenues at the end of the first year of implementation. This means that product concentration has the potential of positioning the GFCB as a strong and strategic incumbent in the competition to control the US market.
Vertical Integration
Apart from a strategic alliance, which faced some challenges due to high supplier power in the US food and beverage industry, the GFCB should consider adopting vertical integration. This strategy involves creating a more dynamic and in-house supply chain process to ensure that most of the production and distribution activities are managed from a central point. For instance, the GFCB may partner with distributors of similar products to ensure that it benefits from a developed distribution network.
This will translates into increased revenues for the company. This means that from a single location, that is, in each restaurant, the GFCB will be able to control all aspects of sourcing for raw materials, selecting different menus, brewing, food preparation, and distribution of special orders. The company many develop these sections into departments that are segmented and disfranchised to track and micromanage the entire value chain.
As a result, this strategy will result in balanced cost, quality, and speed of production to meet the demand. The cost leadership strategy is also likely to reduce the cost of production, thus, giving the GFCB an opportunity to offer very competitive prices for its products. When implemented in a structured manner, vertical integration has the potential of ensuring a smooth transition in different management decisions to avoid the potential of irrational decisions crippling the current efficiency matrices.
Reflectively, the choice of vertical integration was informed by the need to reaffirm the notion of reducing inventory costs to ensure that the final products are given a competitive price tag. Besides, it reduced the supplier forces since most of the production activities will be controlled by the company, not the market forces that are manipulated by the suppliers. The main performance indicator that will reveal the success of this recommendation is reduced inventory cost a year after its implementation since the costs associated with running the production process is expected to plunge. Although the GFCB will have to increase its expenditure at the stage of vertical integration implementation, it is a one-time inventory that has the potential of creating several barriers to competition and minimizing the supplier forces.
Innovative Supply Chain Management
Cost leadership is vital to survive the dynamics of competitive pricing within the food and beverage industry in the US. Therefore, the GFCB may penetrate the US market further through the strategic inclusion of more products in the supply chain that target other market segments such as beer retailers, nutritionists, and corporate institutions. For instance, the company may adopt an innovative approach of product multiple branding to create products that are appealing to the high, middle, and low-income customers.
This will enable the company to create an environment of self-competition and block any potential competitors that might want to specialize in targeting a single customer segment. The objective of this recommendation is to ensure that the GFCB integrates cost leadership strategy to adjust the current production process, quality, and packaging. For instance, the company may remodel its current production process by creating different qualities that have various price tags.
As a result, the GFCB will create a dynamic, optimal, and cumulative experience with potential customers to guarantee increased loyalty. Besides, the company should apply the most cost-effective approach to products by integrating human skills and machines to increase the quality of the output. The success of this proposal will be measured by the number of products that are introduced or modified to fit in different markets, especially a year after implementation.
Strategic Product Development
In the business environment, the aspect of brand knowledge transfer is often enhanced by image and product awareness. This aspect is very important in the food and beverage industry in the US since product attributes, uniqueness, recognition, and recall are interrelated. In relation to the GFCB, the need to grow the current brands in a subjective manner is necessary to create a positive influence on the potential customer.
This is because the company’s restaurant image has the potential of facilitating proactive customer response identification. Through strategic product development, the company may be in a position to improve its product quality and marketing support networks, as captured in the customer response to different brand image stimuli. As a result, the aspect of product differentiation will be focused on quality sustainability and product flexibility. The objective of this recommendation is to bridge the current quality concerns emanating from the excessive powers of the suppliers in order to introduce a more dynamic product brand within the US market and beyond.
The bridging of concerns in quality between brand name and restaurant modeling will reduce the current reputation gap by increasing the brand propensity. In order to achieve these goals, there is a need to create a dynamic brand logo as a marketing strategy.
The stable brand logo will reduce the potential of clients switching brands due to limited image awareness. In the case of the GFCB, the aspect of a brand is inclusive of packaging, name, marketing, and product quality as factors that differentiate the restaurant and on-site brewery products from those of the competitors. This means that it is important to establish healthy brand equity for the GFCB as part of operational efficiency that can track different product lines over a long period of time.
Concentric Diversification
Since the GFCB Company is currently grappling with the challenge of a few product brands since only two product lines are currently functional. There is a need for the company to adopt produce diversification to improve its visibility in the overcrowded market. Since the fresh menus and different alcoholic drinks are the core products of the company, there is a need to introduce multiple brands to engage potential customers.
For instance, the GFCB may adopt a collaborative approach towards creating a positive contribution to the current strategic alliance partners. The company may take advantage of the current supplier network to carry out a free referral advertisement by engaging the suppliers to promote the products. This approach has the potential of turning the current brands and new brands into an avenue for competitive advantage. The objective of this recommendation is to improve the current product line into diversified products that can appeal to different market segments. In order to successfully execute concentric diversification, the GFCB should integrate an appropriate market mix by managing costs to ensure that price tags for different products are competitive.
Bibliography
Blythe, John. Essentials of Marketing Communications. New York, NY: FT/Prentice Hall, 2006.
Brown, Carolyn. Factors Which Influence Customer Buying Decision. London, UK: McGraw Hill, 2009.
Cheverton, Peter. Key Marketing Skills: Strategies, Tools, and Techniques for Marketing Success. London, UK: Kogan Page, 2009.
Cone, Steve. Steal these Ideas: Marketing Secrets that will make you a Star. New York, NY: John Wiley & Sons, 2011.
Dagnino, Giovanni and Rocco, Elena. Competition Strategy: Theory, Experiments and Cases. New York, NY: Rutledge, 2009.
Farooq, Fielding and Jan, Zuena. “The Impact of Social Networking to Influence Marketing Through Product Reviews.” International Journal of Information and Communication Technology Research, 2, no. 8(2012): 627-637.
Farris, Paul, Bendle Neil, Pfeifer Phillip, & Rebstein, David. Marketing Metrics: The Definitive Guide to Measuring Marketing Performance. Alabama, AL: FT Press, 2012.
Hammond, Klein. “Market Segmentation for Competitive Brands.” European Journal of Marketing, 30, no. 12 (2006): 39-49.
Harris, Lisa and Dennis, Charles. Marketing the Business. New York, NY: John Wiley & Sons, 2007.
Ira, Klint. Marketing: What Went Wrong and How to do it Right. Los Angeles, LA: K&A Press, 2009.
Jin, Hyun, Suh, Jaebeom and Donavan, Todd. “Salient Effects of Publicity in Advertised Brand Recall and Recognition: The List-Strength Paradigm”. Journal of Advertising, 37, no. 1(2008): 45-57.
Kotler, Philip and Keller, Kevin. Marketing Management. New Jersey, NJ: Pearson Prentice Hall, 2012.
Liu, Suong, Liao, Syun and Peng, Yen. “Applying the Technology Acceptance Model and Flow Theory to Online Consumer Behavior.” Information System Research, 13, no. 2 (2005): 205-223.
McKinney, Banyte. “Creating a Satisfying Internet Shopping Experience via Atmospheric Variables.” International Journal of Consumer Studies, 28, no. 3(2005): 268-283.
Olsen, Svein and Skallerud, Kare. “Retail Attributes’ Differential Effects on Utilitarian versus Hedonic Shopping Value.” Journal of Consumer Marketing, 28, no. 7 (2011): 532-539.
Roberts, John. “Defensive Marketing: How a Strong Incumbent Can Protect Its Position.” Harvard Business Review, 83, no. 11(2005): 150-210.
Sarin, Loft, Challagalla, Gillian and Kohli, Arnold. “Implementing Changes in Marketing Strategy: The Role of Perceived Outcome and Process-Oriented Supervisory Actions.” Journal of Marketing Research, 3, no. 12(2012): 564-580.
Shar, Alam. “Factors Affecting Consumer Behavior.” Journal of Theoretical and Applied Electronic Commerce Research, 13, no. 2 (2005): 219-234.
Stokes, Rob. eMarketing: The Essential Guide to Digital Marketing. London, UK: Quirk eMarketing (Pty) Ltd, 2011.
Weiss, Joseph. Business Ethics: A Stakeholder and Issues Management Approach. Mason, OH: Cengage, 2008.