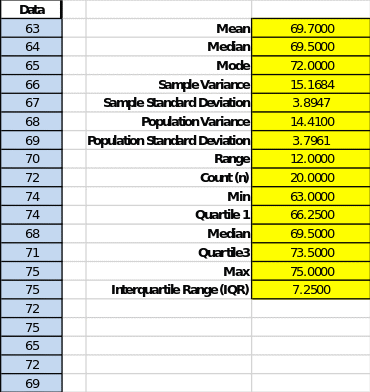
The main objective of this lab work was to conduct a statistical study to determine growth distribution patterns for both the sample and the population. Such analysis is necessary in order to build a deeper understanding of distributions, make assumptions, and make data-driven decisions. Screenshot 1 demonstrates the results of automatic calculations of descriptive statistics, which includes measures of central tendency and variation for a sample of twenty student height values. Thus, the average height of the sample was 69.70 (SD = 3.89), which is slightly higher than my own height. To form a subsample (n = 10), I used a systematic probabilistic method. This involved writing out in a spreadsheet the names of all the students I knew (including those from other educational institutions) and then selecting each third to contact and find out their height. The selected students belonged to different cities but were generally concentrated in the western United States. The approximate age range of the selected participants ranged from 16 to 21, and the group was represented by six males and four females. Thus, each member of the population had an equal chance of being in the final subsample, which increases the representativeness of the data.

Screenshot 2 shows the results of applying the empirical rule to the current sample. The results report that 68% of the observations lie between 65.81 and 73.60, 95% of the observations between 61.91 and 77.49, and, finally, 99.7% of the height observations lie between 58.02 and 81.38 inches. The widening of the interval with increasing precision is not coincidental because the more significant the precision needed for the population mean, the wider the interval that guarantees to fall within the. Screenshot 3 shows the results of calculations to determine the probability (area) from the population of all students who are below my height. Specifically, 34.15% of the students in the population for this study are below my height, and accordingly, 65.85% are above that value.


To summarize, in the present work, automatic calculations were performed using MS Excel-based templates for two weeks in order to study the statistics of the growth distribution in detail. To the ten growth values suggested by the instructor were added the ten values I collected, whose collection algorithm was based on systematic probability sampling. I believe that the added ten values are representative, which was able to increase the overall reliability of the results. Specific statistical tools that were used for analysis included descriptive statistics, the empirical rule, and normal distribution probability. The results showed that 34.15% of the students in the population had a lower height than I did, and the remainder (approximately 2/3) had a higher height.