Introduction
Using statistical analysis to work with data is an essential part of obtaining results and conclusions based on facts. For the purposes of this paper, statistical tools are used to perform regression analysis, the purpose of which is to determine the nature of the relationship between quantitative variables. The independent variable is the residential area, and the dependent variable is the listing price. To specify the analysis, the Pacific was chosen as the region of interest. Regression analysis allows us to determine both the direction of the mutual relationship between the variables and the correlation coefficient, as well as the overall significance of the model. Consequently, conducting it will determine whether or not the area of the property affects the listing price of the property.
Regression Equation
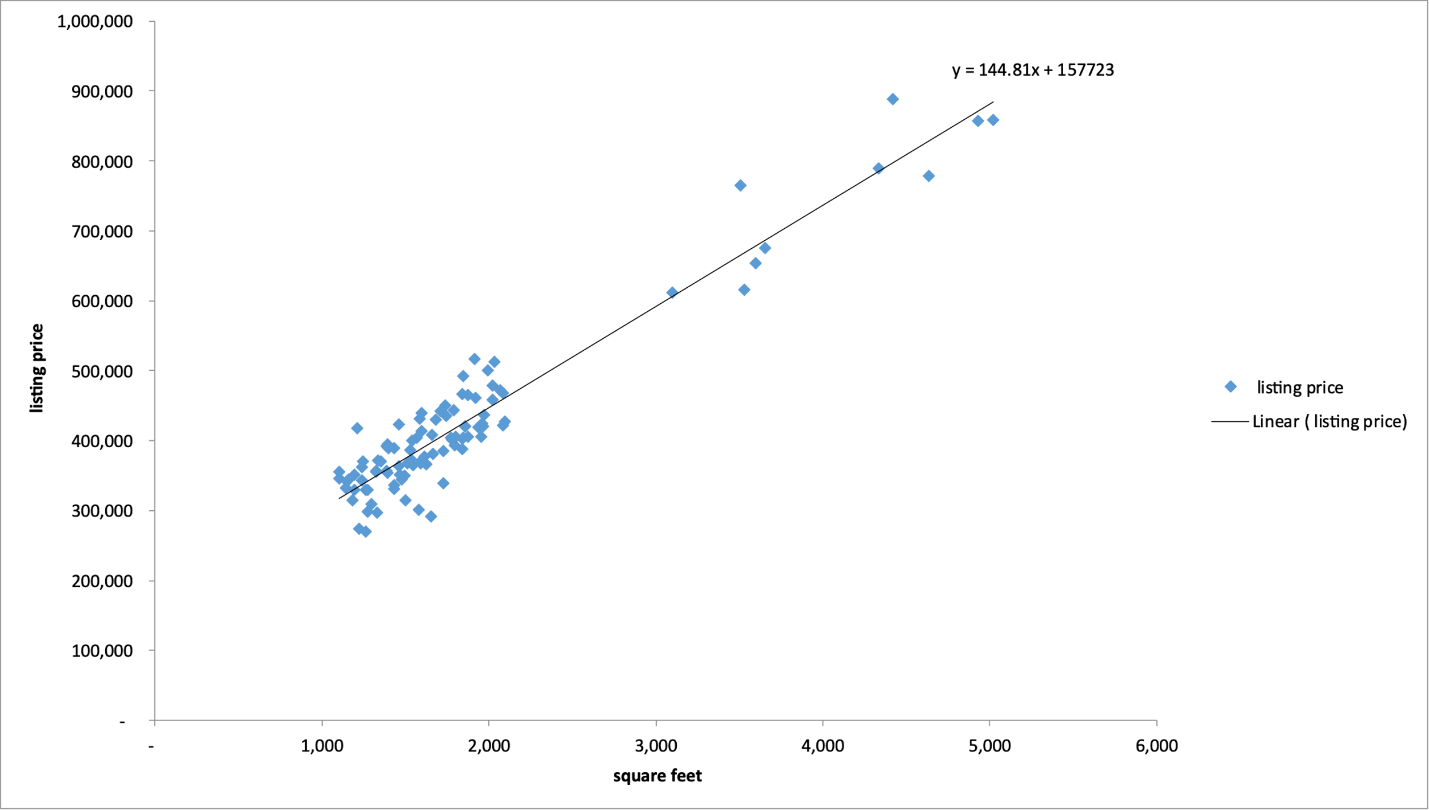
Using Excel, a regression analysis was performed on the data (N = 100), the visualization of which is shown in Figure 1. At first glance, it is noticeable that the data has some upward linear trend, which means that the listing price increases as the floor area increases. Figure 2 shows the results of the regression analysis performed. First, it can be seen that the regression model is significant because F(1.98) =998.260, p <.001. This implies that there is a confirmed relationship between the variables. Second, the coefficients of the regression equation are also significant because their respective p-values are significantly below the critical alpha level (.05). Based on these results, the regression equation in terms of the variables used should look as follows:
![]()
Determine r
The advantage of the regression analysis performed is the ability to calculate the correlation coefficient r automatically. The correlation allows us to determine the direction and strength of the relationship between the variables, and the final value ranges from -1 to +1 (Fernando, 2021). For the current data set, the Pearson correlation coefficient was 0.954 (Figure 2), indicating the existence of an extremely strong positive relationship between the variables. In the context of practical significance, this means that as one variable increases, there is a simultaneous increase in the other variable and vice versa.
Examine the Slope and Intercept
There are two attributes to the calculated regression equation that should be discussed more substantively. First, the slope coefficient shows the trends in one variable compared to the change in the other. The slope coefficient for the equation we found was 144.81, which implies that an increase in floor area for every square foot observes an increase in a listing price of $144.81. Second is the intercept coefficient, which determines the value of the dependent variable when the independent variable is zero. For the current data, the y-intercept was $157,723.48, indicating this value of the room at zero square footage. This value refers only to the value of the land, with no additional built on it.
R-squared Coefficient
In addition to the correlation coefficient, the regression analysis also allows us to determine the value of the R2 coefficient of determination. This value for the current data set is 0.911, as indicated by the results in Figure 2. In the context of the analysis, this means that the constructed regression model can cover up to 91.1% of the variance in the data, which is a high value but displays high model reliability.
Conclusions
In this paper, a regression analysis was conducted to determine the nature of the relationship between residential floor area and listing price. For this purpose, a sample of 100 records for the Pacific region was used. The analysis was able to confirm a significant relationship between the variables, with several findings. First, the correlation coefficient would determine the presence of a strong positive relationship. Second, the coefficient of determination showed that the constructed model covered up to 91.1 percent of the variance in the set. Third, the listing price increased by 144.81 for every square foot as the room size increased. Fourth, the zero price, that is, the price of land alone without additional construction, was $157,723.48. In the context of comparison with national data, the average value (423,844) for the Pacific was higher than the same national scale figure, and the property area (1,838) was lower. The resulting regression equation can be used to predict listing price as a function of square footage at the national level, but the most accurate results will be available for the interval of those square footage used in the analysis performed, that is, up to 5019 square feet.
Reference
Fernando, J. (2021). The correlation coefficient: What it is, what it tells investors. Investopedia. Web.