Abstract
This paper demonstrates the use of financial data for financial analysis. The objective is to carry out a broad financial analysis for an actual company. It explores the various techniques and tools used for financial analysis. In the analysis, we use financial data for Hellenic Community Trust for five year period from 2006 to 2010. The study is based on comparative analysis of historical data of the trust. The study concentrates on the statistical highlights of the trust, ratio analysis (ratios on profitability and liquidity) and a review of capital structure of the company. In addition, percentages are used in the analysis. Graphs are also used to portray trend of various variables in the study over the five year period. Finally, the results are interpreted based on ideal situations and recommendations are done based on the findings.
The key concept of this research paper is comprehensive financial analysis of Hellenic Community Trust.
Introduction
Business units avail audited financial reports at the end of every quarter or mid of year or at the end of the year, as stipulated by law, for external inspection. Such reports are used by different individuals or other institutions such as shareholders, government, employees, community and creditors among others. The financial statements as they are providing the potential users with a narrow insight into the strengths and weaknesses of a business.
This is because what is reported does not give an in depth depiction of the business function over a period of time say five to ten years and it does not compare the performance of the business unit with others in the same industry. Such in depth view of a business are important as they would influence users’ decisions on whether to continue their relationship with an entity and in addition, it would give potential investors adequate information that can aid them in decision making. This brings us the concept of financial analysis.
Financial analysis is the process of evaluating businesses, projects, budgets and other finance-related entities to determine their suitability for investment. Basically, a comprehensive financial analysis is done on an institution’s financial statements to establish if an entity is stable, solvent, liquid, or profitable enough to be invested in.
When looking at a specific company, the financial analyst will often focus on statement of income, statement of financial position, cash flow statement and statement of changes in equities (Adams, 2006, p.12). In addition, one key area of financial analysis entails extrapolating the company’s past performance into an estimate of the company’s future performance. While inferring the current performance into the future, time value of money is taken into consideration.
Different companies have different financial structures depending on the nature of business. Some organizations carry out businesses that cut across several industries making them have complex financial structures while businesses of other entities fall in one industry enabling them have simple financial structures. The application of tools and techniques for financial analysis will depend on the complexity of the business structure of the company and to a greater extent on the capital structure of the company (Atrill and McLaney, 2006, pp.54-60).
Hellenic Community Trust is a charitable company limited by guarantee, incorporated on the 2nd October, 1991. The activities of the trust are to provide or assist in the provision of a community centre containing facilities for recreation or other leisure time occupations and advancement of public education in the history, religion, culture and traditions of Hellenism (Bridge and Moutinho, 2000, P.79). Other than offering charitable services, the trust is engaged in some income generating activities.
The objective of this paper is to carry out a comprehensive financial analysis on the financial statements of Hellenic Community Trust and draw inferences on the financial status of the trust. This analysis will cover a five year period from 2006 to 2010. At the end of the study, we will be able to conclusively locate the financial position of the trust in terms of profitability, liquidity and going concern. Further, we will be able to make recommendations based on the findings of the scrutiny.
Statistical Highlights of Hellenic Community Trust
Income for the trust is generated from both restricted and unrestricted funds and it comprises of income from generated fund and charitable activities. Major source of income is from the generated funds with major activities being venue letting for fund raising purposes and catering (Atrill and McLaney, 2006, pp. 123-151). Income from generated funds totaled to 72.9% of the whole income as reported in 2006 and 69.1% in 2010.
In addition, income generated from unrestricted resources is much greater than income generated from restricted sources. In 2006, income generated from unrestricted sources constituted 86% of the total income and in 2010, 99.5%. Further, expenses relating to charitable activities were relatively higher than those relating to generating fund for the period 2006 to 2010. This can be attributed to the knowledge that it is a charitable organization. A summary of incoming resources reported for the period is indicated below.
Condensed statement for financial performance from 2006 to 2010
Table 1.0 (All the amounts in this study will be in £ unless otherwise indicated)
From the above table, total incoming and net incoming resources, from both restricted and unrestricted funds, for HTC has varied over the five years. The highest total incoming resources amounting to £ 750,723 was recorded in 2008 while the lowest in 2006 amounting to £ 684,506. The net incoming resources started off with an increase in 2006 and 2007, recording a high increase in 2007 of 21.4% and declined drastically at a rate of 64.8% in 2010. From 2008 to 2010, the trust experienced a declining trend in both total and net incoming resources as can be seen in the graph below. The worst performance being experienced in 2010, net incoming resources declined by 64.8%. There is no major investment during the period from 2008 to 2010 that can be attributed to the plunge in performance.
Graph of trend analysis of financial performance from 2006 to 2010
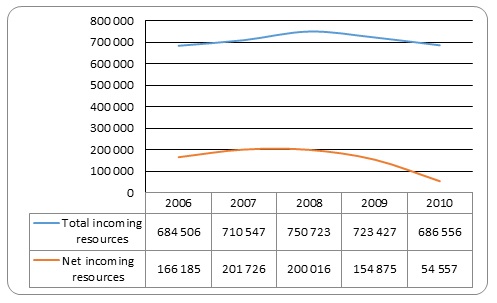
- Horizontal axis represents the years of study
- Vertical axis represents incoming resources in £
The graph above portrays the trend of total incoming resources and net incoming resources HCT, over the years. There is an increase in both net and total incoming resources from 2006 and the peak is reached in 2008, thereafter a plunge in 2009 to 2010.
Capital structure of HCT
The term capital structure refers to the percentage of capital (money) at work in a business by type. Broadly speaking, there are two forms of capital: equity capital and debt capital. Each has its own benefits and drawbacks and a substantial part of wise corporate stewardship and management is attempting to find the perfect capital structure in terms of risk / reward payoff for shareholders. This is true for Fortune 500 companies and for small business owners trying to determine how much of their startup money should come from a bank loan without endangering the business (Atkinson, Berry, and Jarvis, 1995. Pp. 167-203).
The capital structure of HCT does not contain common sources of funds such as equity and debt financing as noted in most organizations. The structure is made up of accumulated fund. This explains why the audited financial statements do not have statement of changes in equity and a cash flow statement. In addition, it narrows down the tools and techniques which can be applied in analyzing the financial status. This would imply that we cannot analyze key areas such as the solvency of the trust as it lacks debt financing also, we cannot carry out DuPont analysis on the financial data. The table below depicts changes in accumulated fund over the period of study.
Table 1.1. Summary of growth of accumulated fund from 2006 to 2010
From the table above, we note that accumulated fund has been growing but at declining rate throughout the period. The increase sparked off so well at 11% in 2006 and declined to 1.4%. This trend implies net incoming resources that makes up the accumulated fund has been falling. In addition, if this trend persists, it would reach a position where the accumulated fund would be devoted in the operation of the trust, that is, the trust would not be self sustaining in the long run. The graph below depicts the trend of growth in accumulate funds.
Graph of accumulated fund over the five years
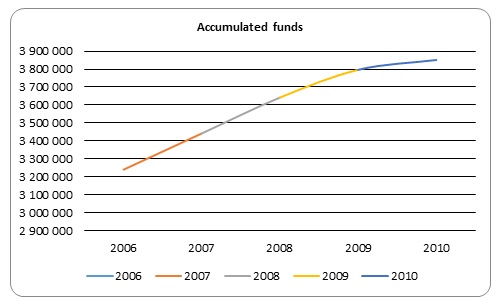
- Horizontal axis represents the years of study
- Vertical axis represents accumulated funds in £
Ratio analysis of Hellenic Community Trust
A common technique of analyzing financial information of an institution is by computing ratios. The results can be compared with those of other companies in the same industry or against the company’s own historical performance. The ratios could be calculated for several years and compared as part of a larger analysis (Atkinson, Berry, and Jarvis, 1995. Pp. 167-203). Ratios can indicate the profitability, liquidity, solvency or stability of HCT over the period 2006 to 2010.
Profitability is the ability of an entity to earn income and sustain growth in both short term and long term. Some of the ratios which can be used to analyze profitability include gross profit margin, operating profit margin, net profit margin, the return on assets (ROA) ratio, and the return on equity (ROE) ratio. (Adams, 2006, pp.11-12) The profitability of HCT can be analyzed by reviewing the income and expenditure account. Several ratios will be computed to give a good depiction of the trust’s profitability from the year 2006 to 2010. The table below gives a comparative analysis of profitability of HCT for the five years.
Table 1.2. Table of profitability ratios.
Due to the nature of the organization we were able to work out two ratios to analyze the profitability of the trust that is, the return on assets and profit margin. Both ratios indicated an increase in 2007 that is 5% to 6% for return on assets and from 12% to 14% on profit margin. In addition, there was a decline in the period 2008 to 2010 from 5% to 2% for return on assets and from 13% to 8% on the profit margin. These trends are clear on the graph below. A downward trend in return on asset implies that the assets are growing faster than sales (Atkinson, Berry, and Jarvis, 1995. Pp. 167-203). This is a bad trend for the trust as it is accumulating assets which it does not use to generate revenue.
Further, a downward trend on the profit margin implies that the profitability of the trust is deteriorating to a low of 8%. In addition, we could deduce that there a problem with the management especially in general operations and administrative (Butterworth, 2009, p.87). This situation can lower confidence of potential investors because it would imply that the management is unable to utilize the assets and control its expenses to generate an acceptable rate of return. However, the chairman of the trust attributed the deprived performance to the adverse economic condition that prevailed during the period 2008 to 2010. The graph below shows trend of return on assets and profit margin over the period.
Graph showing trend of return on assets and profit margin
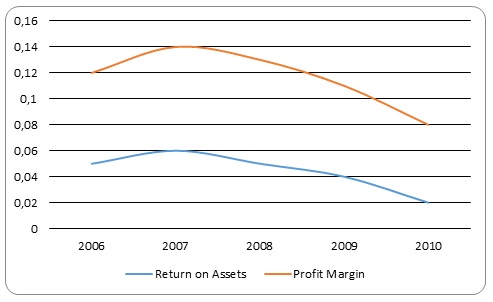
- Horizontal axis represents the years of study
- Vertical axis represents profit margin and return on assets
Analysis of liquidity is necessary as it establishes the ability of an organization to maintain positive cash flow while satisfying immediate obligations, that is, the availability of cash to pay debt. The computation of these ratios will be based on the cash flows or liquid assets. The most common ratios used to analyze liquidity are current and quick ratio. The table below gives a summarized computation of the ratios.
Table 1.3. Table of liquidity ratios.
From above computations, current ratio ranges from 8.86 in 2006 and increased over the years to 28.43 in 2010. Similarly, quick ratio, which is a more conservative measure, ranged from 8.78 in 2006 to 28.35 in 2010. Net working capital ratio also increased across the years; in 2006 we had 0.17 while in 2010, 0.30. We can deduce that HCT is able to meet its immediate obligations as a liquidity ratio greater than one is excellent. In addition, HCT is very liquid. Despite the declining trend in profitability, HCT is more than capable of paying its short term creditors. Further, the high rates of liquidity ratios imply that the trust has a very poor use of liquid cash as it is holding current assets in cash at hand or in bank as is evident from the statement of financial position.
Probably, this can be attributed to the nature of operations, its being a charitable organization (Bowdin, 2006, p.121). Even though the trustees are optimistic with the future of the trust, they expressly state that there are no material uncertainties that may cast significant doubt about the ability of the trust to continue as a going concern and there is neither the intention nor the need to even consider liquidation or cessation of operations not only in respect of the year commencing January 2011 but for the foreseeable future, the liquidity ratios indicate a depriving situation of the trust. The trustees attribute the liquidity situation to the high deposits they receive which amounts to over £ 1 million with bankers.
Methodology
The study used data of Hellenic Community Trust (HCT) for the five year period from 2006 to 2010. Financial analysis of the trust is based on the commonly used tools and techniques such as ratio analysis on profitability and liquidity, use of percentages, analysis of capital structure and Du-Pont analysis among others. These tools and techniques are applied on the statement of income and statement of financial position of the trust (Kotas, 1999, p.167). The results are then explained and extrapolated to predict the future.
Conclusion and recommendation
Financial analysis can be complicated depending on the nature of the company. Comprehensive analysis of financial statements of companies which do not fall into a single industry tend to be more complex than those which fall in one single industry (Thomson O’Toole and Mikolaitis, 2002, pp. 129-157). HCT is a charitable organization. It is not involved in day to day purchase and sale of goods and services but rather offers services relating to letting of rooms for functions, catering and provision of education.
Its operation is based on restricted and unrestricted funds (Butterworth, 2009, p.57). This renders it to have a simple financial structure which is relatively easy to evaluate. From the above examination, we notice that net incoming resources of HCT are declining. This poses a doubt on the going concern of the charity. The ability of the trust to sustain its self in the long run is also varnishing as it has recorded dipping profitability for three years, 2008 to 2010. In addition, liquidity of the trust is soaring. It exceeds the ideal rates. The current state of affairs casts doubt on the going concern of the trust.
The trust was formed as a charitable organization and not a profit making institution. However, if the trustees would wish to run it a self sustaining organization, then they should concentrate on turn around strategies (Wiley, 1998, p.123). Such strategies should be geared towards reversing the trend of profitability of the trust. In addition, the management of the trust should look into the liquidity by ensuring that it stays at ideal rates. To form a strong asset base of the trust, the management should look into ways of investing the liquid assets.
Reference List
Adams, D., 2006. Management Accounting for the Hospitality, Tourism and Leisure Industries: a strategic approach, 2nd ed., Massachusetts: Thomson Press.
Atkinson, H, Berry A. and Jarvis R., 1995. Business Accounting for Hospitality and Tourism. New York: Thomson.
Atrill, P. and McLaney, E., 2006. ‘Accounting and Finance for Non-Specialists’. Financial Times. New York: Prentice Hall.
Bowdin, G., 2006. Events Management, Cambridge: Rutledge Press.
Butterworth, B., 2009. Management and the Arts 4th ed., Massachusetts: Forcal Press.
Bridge, J and Moutinho, L., 2000. Strategic management in tourism, California: CABI
Kotas, R., 1999. Management Accounting for Hospitality and Tourism, London: International Thomson Business Press.
Thomson O’Toole, W. and Mikolaitis, P., 2002. Corporate Event Project Management, New York: John Wiley and Sons.
Wiley, G., 1998. Accounting for Hospitality, Tourism and Leisure. London: Pearson.