Abstract
This paper demonstrates the use of ratios in financial analysis. Financial data of Marks and Spencer for a two-year period from 2010 to 2011is reviewed. The study is based on comparative analysis of historical data for this entity. The study applauds the statistical highlights of this group and ratio analysis (ratios on profitability, liquidity, financial gearing and efficiency). In addition, percentages are used in the analysis to monitor changes overtime. Graphs are also used to portray trend of various variables in the study over the two-year period. The results are interpreted in comparison to ideal situations and recommendations made from the findings. Further, drawbacks of ratio analysis as a tool for monitoring financial performance are evaluated. Finally, an in-depth evaluation of accounting principles used in the preparation of Marks and Spencer accounts is reviewed.
Statistical highlights
Marks and Spencer is an international company having several stores in the United Kingdom. The Company deals with clothing and food products. For reporting purposes, revenue is divided into two segments, that is, revenue from UK and that from international markets. Vast amount of sales was generated from UK market than in other markets in the report. In 2011, UK generated 89.7% of the revenue amounting to £8,733 million while the remaining 10.3% was generated from international markets. There has been no major change in the capital structure for the corporation over the two-year period. The table 1.0 shows summary of financial performance of Marks and Spencer for the two year period from 2010 to 2011.
From table 1.0, Mark and Spencer had a growth in performance in the two year period. Revenue increased from £9,536.6m in the financial year 2010/2009 to £9,740.3m in 2011/2010. Profit after tax for the group similarly increased by 14.5% from £523 in 2010 to 598.60 in 2011. Dividends and earnings per-share also improved in the two-year period. This growth indicates a good trend for the entity. A thorough review of the financial statements is analyzed in the coming sections.
Scope and objective of the study
The objective of this paper is to carry out a comprehensive financial analysis using ratios on the financial statements of Marks and Spencer and draw inferences on the financial status of the company. This analysis will cover two-year period from 2010 to 2011. At the end of the study, it will be possible to conclusively locate the financial position of the company in terms of profitability, liquidity and efficiency. Further, drawbacks of ratio analysis as a measure of performance will be discussed and concluded with an evaluation of accounting principles.
Introduction
Marks and Spencer audited financial reports are used by various groups such as shareholders, government, employees, community and creditors among others. According to David (2005), financial statements provide the potential users with a narrow insight into the strengths and weaknesses of a business. This is because what is reported does not give an in-depth depiction of performance of an entity. Such full view of a business is important as it would ultimately influence users’ decisions on whether to continue their association with an entity and in addition, give potential investors adequate information to aid them in decision making. Thus, the concept of financial analysis.
Ratio analysis
Financial analysis is the process of evaluating businesses, projects, budgets and other finance-related documents to determine their suitability for investment. Basically, a comprehensive financial analysis is done on an institution’s financial statements to establish if an entity is stable, solvent, liquid, or profitable enough to be invested in. When looking at a specific company, financial analyst will often focus on statements of income, statement of financial position, cash flow statement and statement of changes in equities. Ratio analysis is a key technique for financial analysis. While inferring the current performance into the future, time value of money is taken into consideration. This section will analyze financial statements of Marks and Spencer using ratio analysis for the year 2011 to 2010.
Profitability ratios
According to Eugene and Michael (2006), profitability is the ability of an entity to earn income and sustain growth in both short term and long term. Various ratios are used to analyze profitability such as gross profit margin, operating profit margin, net profit margin, the return on assets (ROA) ratio, and the return on equity (ROE) ratio (Eugene and Michael, 2009). Profitability of Marks and Spencer can be analyzed by reviewing the income and expenditure account. Several ratios will be computed to give a good outlook of the company’s profitability from the year 2010 to 2011. Table 2.0 gives a comparative analysis of profitability of Marks and Spencer over the two years.
From the table, four ratios are computed to illustrate profitability of Marks and Spencer, that is, return on assets, return on equity, gross profit margin and net profit margin. Gross profit margin remained stable for the two years at 9%. This indicates that the company manages well its inventory, pricing and production efficiency. Net profit margin increased from 5% to 6% which imply that the group generated adequate sales revenue to cover fixed costs and also improved on profitability. Even though the net profit increased, return on equity declined in 2011 from 24.1% to 22.4%. The decline implies that return on investment has become less risky as high risk would attract high return.
Graph showing trend of profitability ratios:
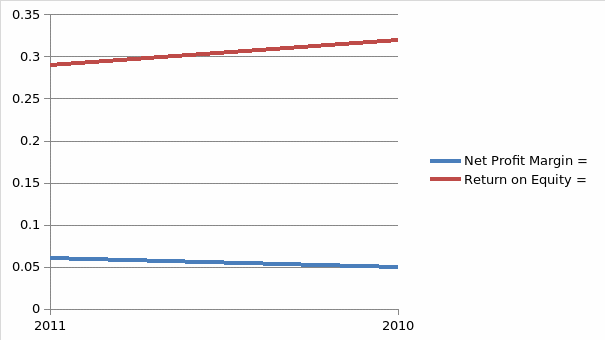
- Horizontal axis represents years
- Vertical axis represents the percentage change
Liquidity ratios
According to Eugene and Michael (2009), analysis of liquidity is necessary as it establishes the ability of an organization to maintain positive cash flow while satisfying immediate obligations, that is, the availability of cash to pay debt. The computation of these ratios will be based on the cash flows or liquid assets. They define liquid asset as those tradable in an active market and thus can be quickly converted to cash at the going market price. The most common ratios used to analyze liquidity are current and quick ratio (Eugene and Michael, 2009). Table 2.1gives a summarized computation of the ratios.
From the table, it is clear that current ratio for Marks and Spencer ranges from 0.80 in 2010 to 0.74 in 2011. Similarly, quick ratio ranges from 0.48 in 2010 to 0.43 in 2011. Further, the liquidity ratios for the two years are less than one. It is in order to infer that Marks and Spencer has poor liquidity ratios and it is not able to meet its current obligations if compared with ideal rates. David (2003) states that ideal current ratio should be 2:1 while quick ratio 1:1, however this can change depending on the industry ratios.
Financial gearing
According to David (2003), financial gearing shows a company’s vulnerability to risk, for example, the degree of protection provided for the business’ debt. Several ratios can be used to measure the safety of a business entity such as debt to equity. Computation of ratios for safety for Marks and Spencer is captured in table 2.2.
According to David (2003), debt to equity ratio quantifies the relationship between the capital invested by owners and investors and the funds provided by creditors. The higher the ratio, the greater the risk to current or future creditor and a lower ratio means client’s company is more financially stable and is probably in a better position to borrow now and in the future. An extremely low ratio may indicate that a client is too conservative and is not letting go the business in realizing its potential. From the computations, it is clear that debt to equity ratio has declined from 2.27 in 2010 to 1.74 in 201, similarly long-term debt to equity declined from 1.05 in 2010 to 0.72 in 2011. This implies a decrease in risk to current or future creditor and that Marks and Spencer is more financially stable. On the contrary, earnings before interest and taxes/ interest charges have increased from 5.3 in 2010 to 8.5 in 2011. The increase implies that the entity has a greater ability to make its interest payment s or take more debt. This trend can be shown in the graph.
Graph showing trend of debt to equity ratio:
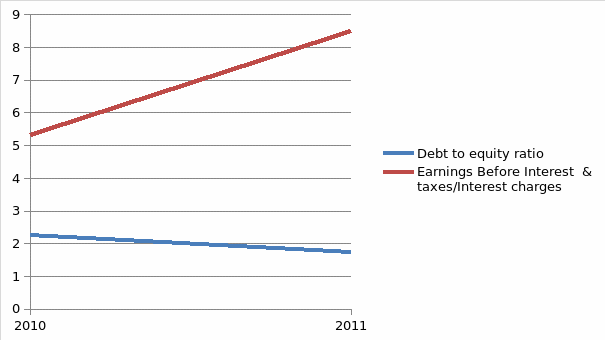
- Vertical axis represents financial gearing ratios
- Horizontal axis represents the years
Efficiency
According to David (2003), efficiency ratios provide an indication of how well a company manage its resources, that is, how well a company employs its assets to generate sales and income. Further, it also shows the level of activity of the corporation as indicated by the turnover ratios. Commonly used ratios are accounts receivable turnover, accounts payable turnover, days payable among others. Computations of these ratios in context of Marks and Spencer are shown in table 2.3.
From the table, level of efficiency of the entity has remained stable over the two year period as indicated by accounts receivable turnover (15.56 in 2010 and 15.00 in 2011). Average payable period declined from 5.13 in 2010 to 4.81 in 2011, this could indicate a decline in level of activity. On the contrary, sales to net worth have declined from 4.44 in 2010 to 3.64 in 2011. According to David (2003), sales to net worth ratio indicates how many sales units are generated with each unit of investment while sales to total assets ratio indicates how efficiently the company generates sales on each unit of assets. It measures the ability of a company’s assets to generate sales (David, 2003). From above computations, the ability of Marks and Spencer to generate sales from net worth and assets has declined over the years. This scenario can lower potential investors’ confidence on ability of the entity to generate returns from their capital. From this, it can be deduced that the entity has not been able to generate adequate sales from the investment so as to maintain the same level of profitability. Sales to total assets has remained constant in the two year period, this indicates that the entity has been able to generate constant sales from the total assets. The graph below depicts the trend of efficiency in the years.
Graph of accounts receivable turnover and sales to equity ratio:
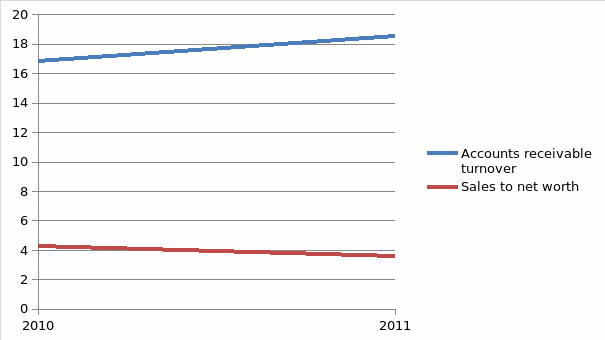
- Vertical axis represents ratios of accounts receivable turnover and sales to net worth ratio.
- Horizontal axis represents the years
Investment ratios
David (2003) states that price/earnings ratio is the most commonly used to evaluate investment in an entity. He further points out that historically, the average P/E ratio for the broad market has been around 15, although it can fluctuate significantly depending on economic and market conditions. A stock with a high price/earnings ratio suggests that investors are expecting higher earnings growth in the future compared to the overall market while a stock with a low price/earnings ratio suggests that investors have more modest expectation for its future growth compared to the market as a whole (David, 2003). From the computations of price/earnings ratio for Marks and Spencer in table 2.4, the ratio declined from 10.8 in 2010 to 9.44 in 2011. This decline may not be attractive to prospective growth investors despite the increase in earnings per share and dividends.
Drawbacks of ratio analysis
Ratio analysis forms an essential technique for financial analysis. However, this technique faces numerous hitches which subject it to reservations in using it. Eugene and Michael (2009) highlight the various drawbacks. First, they point out that numerous firms have divisions that operate in different industries, and for companies such as Marks and Spencer which operate in several industries, it is difficult to develop a meaningful set of industry averages. Therefore ratio analysis is useful for narrowly focused firms. Inflation has distorted many firms’ balance sheet as book values are often different from the market values. Market values would be more appropriate than book values but we cannot generally get market value figures for items such as used assets as they are not traded. Further seasonal factors can also distort a ratio analysis for instance, the inventory turnover ratio for a food processor will be radically different if the balance sheet figure used for inventory is the one just before versus just after the close of canning season. Also, different accounting practices can distort comparisons for instance inventory valuations and depreciation methods can affect financial statements and thus distort comparison among firms. Finally it is difficult to generalize about whether a ratio is good or bad, for instance a high current ratio may be good as it indicates a strong liquidity position, but it may also be bad as it indicate excessive cash (Eugene and Michael, 2009).
Accounting principles
Accounting principles are the regulations and guidelines used in recording and preparing the financial statements. One of the main accounting principles used in preparing financial statements for Marks and Spencer is the going concern principle. This principle assumes that an entity will remain in operation for the foreseeable future. The board is satisfied that the group will be able to operate within the level of its facilities for the foreseeable future. Further, the financial statements are drawn up on the historical cost basis of accounting as depreciation of assets is computed based on the historical book value of the assets and not the market value. Also, the entity adopted revenue recognition and matching principle as revenue is recognized when significant risks and rewards of ownership have been transferred to the buyer and revenue from sale of furniture and online sales are recorded on delivery of the goods to the customer. Finally, use of time period principle as final dividends are recorded in the financial statements in the period in which they are approved by the company’s shareholders while interim dividends are recorded in the period in which they are approved and paid.
Conclusion
Financial analysis can be complicated depending on the nature of the company. Comprehensive analysis of financial statements of companies which do not fall into a single industry tend to be more complex than those which fall in one industry. Businesses of Marks and Spencer cut across various industries making it to have a complex structure. From the above analysis, profitability of the organization has generally increased in two year period as indicated by the profit margin ratios. The entity has a poor liquidity as both the current and quick ratios are low and deteriorating. Debt to equity ratio shows that the company has improved its ability to take up more debt and is able to pay interest expenses. Further, price/earnings ratio has declined which may paint a bad picture to the potential investors.
Even though ratio analysis is a vital tool for financial analysis, it has several inherent limitations. For instance, it is not possible to come up with different averages for companies whose business cut across several industries such as Marks and Spencer. Further, various accounting practices are applied in various companies and it makes it difficult to compare performance of two companies with different accounting practices. Despite the shortcomings, the results from ratio analysis heavily relied on in decision making process.
Appendix
Summary of financial performance from 2010 to 2011
Table 1.0 (All the amounts in this study will be in pounds unless otherwise indicated)
Table of profitability ratios
Table 2.0
Table of liquidity ratios
Table 2.1
Table of safety ratios
Table 2.2
Table of efficiency ratio
Table 2.3
Table of investment ratios
Table 2.4
Works Cited
David, Vance. Financial analysis and decision making: Tools and techniques to solve. United States: McGraw-Hill books, 2003. Print.
Eugene, Brigham, and Michael, Ehrhardt. Financial management theory and practice. London: Cambridge, 2009. Print.