Abstract
This paper uses statistical analysis to compare the average sample cost per square foot to the reported cost per square foot. Data for the Pacific region is used to specify the study. This includes selecting a random sample, calculating descriptive statistics, choosing an appropriate parametric test, as well as interpreting the results.
Introduction
MS Excel was used to create the random sample. Since the subject scenario specified information for the Pacific region, a random value was written to each row using =RAND() to create a more plausible and random sample. The rows were then sorted according to the random value in ascending order, after which the first 750 values were selected for analysis. The data was generated and recorded in MS Excel so that statistical analysis could be performed on it.
Setup
A population specific to the Pacific region was used for this assignment. These were 1,001 records in an MS Excel file (see file MAT 240 House Listing Price by Region) for which listing price, square footage, and cost per square foot were reported. It is reported that for this population, the mean value was $280. Accordingly, the null hypothesis indicates that the population mean is (=) $280, whereas the alternative hypothesis suggests that this parameter is less than (<) $280. Since the hypothesis turns out to be directional, a left-tailed parametric test will be used for this test.
Data Analysis Preparations
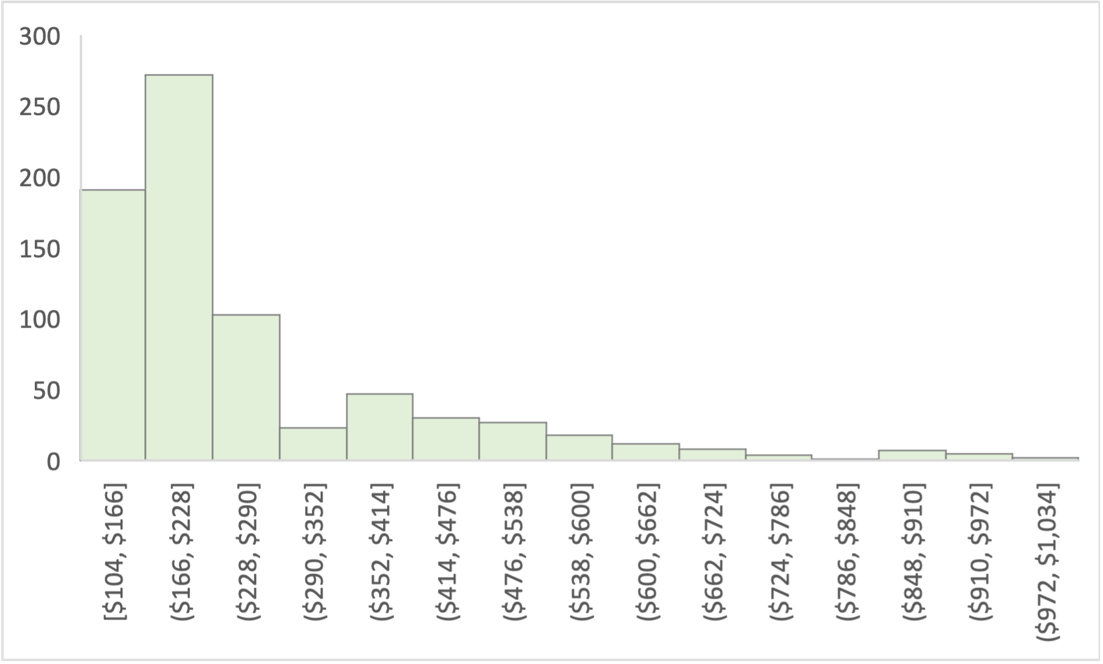
The sample generated consisted of 750 records randomly selected from the general population. For the sample, the mean was $264.50, while the standard deviation was $162.05. This means that in the test group, each cost per square foot, on average, deviated by $162.05 from $264.50; the median value for the distribution was $202.25. Figure 1 shows the histogram for the generated sample: it is easy to see that this distribution is right-skewed, which means it can have outliers at the right end (Gupta, 2022). To perform the one-way t-test, assumptions were made about the continuity of the data, the randomness of the distribution, the independence of the observations, and the sufficiently large sample size (n = 750). However, the assumptions of normality were not met because the distribution (Fig. 1) is not normal. However, the population distribution for the Pacific region from MS Excel was also not normally distributed and had a right-skewed shape, so we can conclude that the parametric t-test can be used.
Calculations
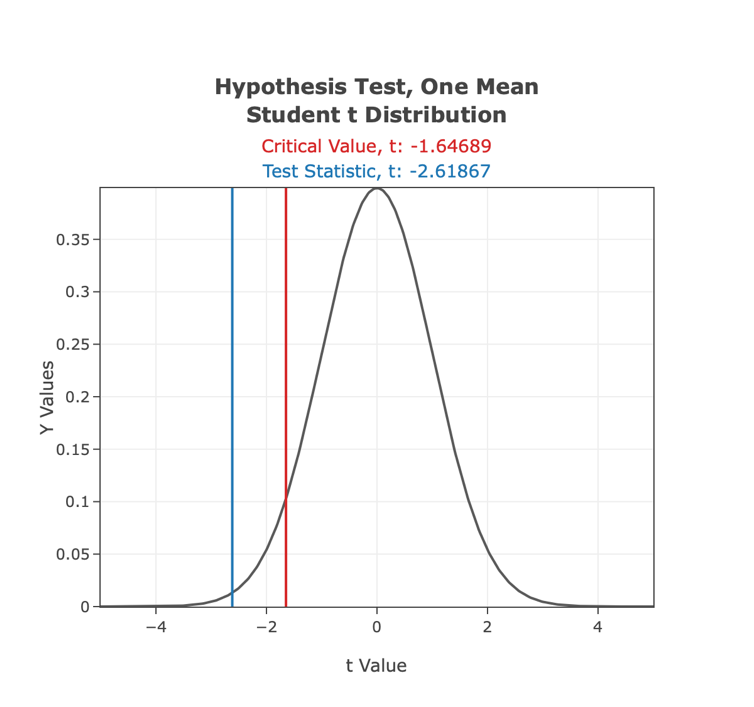
A degree of freedom value of 749 was used for the calculations because only one sample was presented. Since the test was left-handed, the corresponding function was =T.DIST([test statistic], [degree of freedom]). This formula uses the value of the test statistic, which was calculated in MS Excel using the function =($264.50-$280)/($162.05/SQRT(750)) and was -2.62 (IET, 2022). By substituting this value into the above formula, it was found that the p-value for this test was.0045. Figure 2 shows a graph of the normal distribution curve. It shows that the value of the test statistic (-2.62) is in the outlier region since it is significantly less than the critical value (-1.65).
Test Decision
The p-value is significantly below the.05 threshold, which implies that the null hypothesis should be rejected for having statistically significant evidence. In other words, it follows that the average cost per square foot in the Pacific is below the $280 mark.
Conclusion
This paper conducted an inferential analysis to evaluate the hypothesis of the average cost per square foot in the Pacific region. A random sample size of 750 lines was obtained from the population; the calculations showed the need to reject the null hypothesis. It follows that the analysis demonstrated that the average cost per square foot was significantly lower than the stated.
References
Gupta, S. (2022). Understanding descriptive statistics: with the help of gaussian, left-skewed, and right-skewed dataset. TDS. Web.
IET. (2022). How to calculate a test statistic (with types and examples). Indeed. Web.