Introduction
In analyzing the real data for the Regional Real Estate Company, there is a need to conduct a descriptive statistic for the available dataset. The analysis, therefore, assists in making decisions on whether the new advertisement designed adds value to the company or not. The company has proposed to implement an advert scheme which would cost it an average cost of $280 per square foot. This report presents the various processes of conducting analysis, testing for the hypothesis, generating samples, and making decisions on the best alternative to be undertaken by the sales team in the company.
Sample Generation
In generating the sample size of 750, Fisher’s formula has been used, which involves the following steps. Firstly, determine the population size in the survey. The population size of 1001 is known and determined from the data set available. Secondly, determine the confidence level using the formula: Confidence interval= sample mean±confidence level value*z-score*(std deviation/√sample size).
The standard deviation used in this step is the known deviation of 161.76. The confidence interval, therefore, is; 264.02±0.05*z*(161.76/√1001=264.02±(Z*(5.11)=264.02±5.11Z. The third step is determining the confidence level. This data set’s confidence level is pre-determined at 0.05 or 5%. The fourth step is determining the standard deviation, known in this case as 0.5. Finally, convert the confidence level into a z-score. This means that from the calculations, the sample size is 750.
Setup
Population Parameter
The population parameter is the set of data that describes the entire population. From the real estate dataset, the parameter is 1001 since it contains all the observations in the study. This parameter’s sample of 750 has been computed using Fisher’s formula above.
Null And Alternative Hypothesis
The null hypothesis is an argument that there exists no relationship between the two or more variables, while the alternative hypothesis is an argument that there exists a statistical significance between two or more variables.
- Null hypothesis: H0: There is a significant relationship between new advertising and company revenues.
- Alternative hypothesis: HA: There is no significant influence between new advertising and company revenue.
Test Used
From the sample of 750 and the confidence level of 0.05, the test chosen is one-tailed since the rejection region falls on one tail. This means that only one area is rejected in the null hypothesis. From the test, a left-tailed test is selected to represent the hypothesis.
Data Analysis Preparations
Sample Description
The sample size is the number of observations in the study. This dataset represents a sample of 750 observations. Sample influences two key statistics characteristics: how precise the estimates have been used and the power to conclude the sample used.
Descriptive Statistics
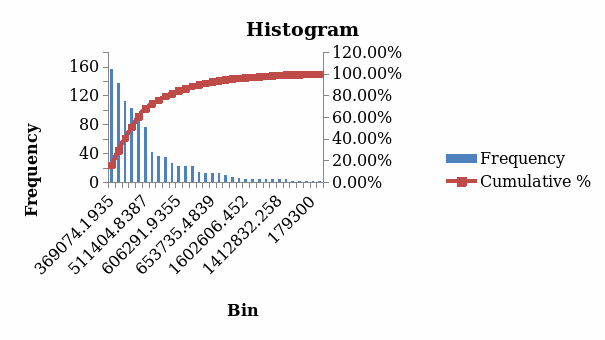
Histogram

Whether The Assumptions Have Been Met
From the calculated sample mean, standard deviation, median, and the histogram presented, the conditions for identifying a left-tailed test have been fulfilled from the information in the dataset. The presented data indicates a kurtosis of 3.81, skewness of 1.98, and confidence level of 0.396 from the alpha of 0.05. This indicates that the sigma points towards the left.
Test Statistic and Significance Level
A test statistic is computed from a test that shows how the data in the sample matches the expectations in the null hypothesis. It is used to decide on whether to accept or fail to accept the hypothesis. In the sample size of 750, the test statistic chosen is the t-value since the null hypothesis indicates that there are equal means for two data groups. Hence, t-tests and regression tests are used to compute the hypothesis. The level of significance chosen is 5% or 0.05.
Calculation of P-Value
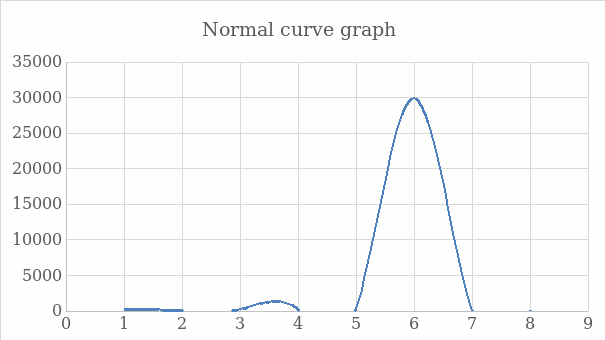
The p-value is computed based on the sample distribution along the test statistic chosen. The p-value computed of the left-tailed test in the distribution above is p(H0≤750) =cdf (observed value of t-statistics). Hence the p-value from this set is 0 with a t-critical value of 1.645.
Normal Curve Graph

Relationship Between P-Value and Significance Level
P-value assesses the probability of obtaining results from the sample when it is assumed that the null hypothesis is true. When the p-value is low, the observations have a greater statistical significance. In addition, a p-value of 0.05 and below are generally statistically significant. From the calculated p-value in the data set of 750, the p-value was 0, meaning there was a statistically significant difference in the observations. With the p-value of less than 1% or 0.01, it shows that the null hypothesis is correct. Therefore, the null hypothesis is rejected, and the alternative hypothesis fails to be rejected.
Conclusion
In conclusion, based on the p-value computed from the sample size of 750, there was a strong significance between the variables, demonstrating that when the new advertising method is implemented, it strongly impacts the company’s revenue growth. In the null hypothesis demonstrated earlier, new advertising had no significant influence on company revenues. When the p-value is computed, it shows that there was a strong relationship between the two variables; hence the null hypothesis is rejected while the alternative hypothesis is accepted. Generally, when the advertising mechanisms are introduced into the company, there would be savings of $280 per square foot, improving the company’s revenue.