
Background
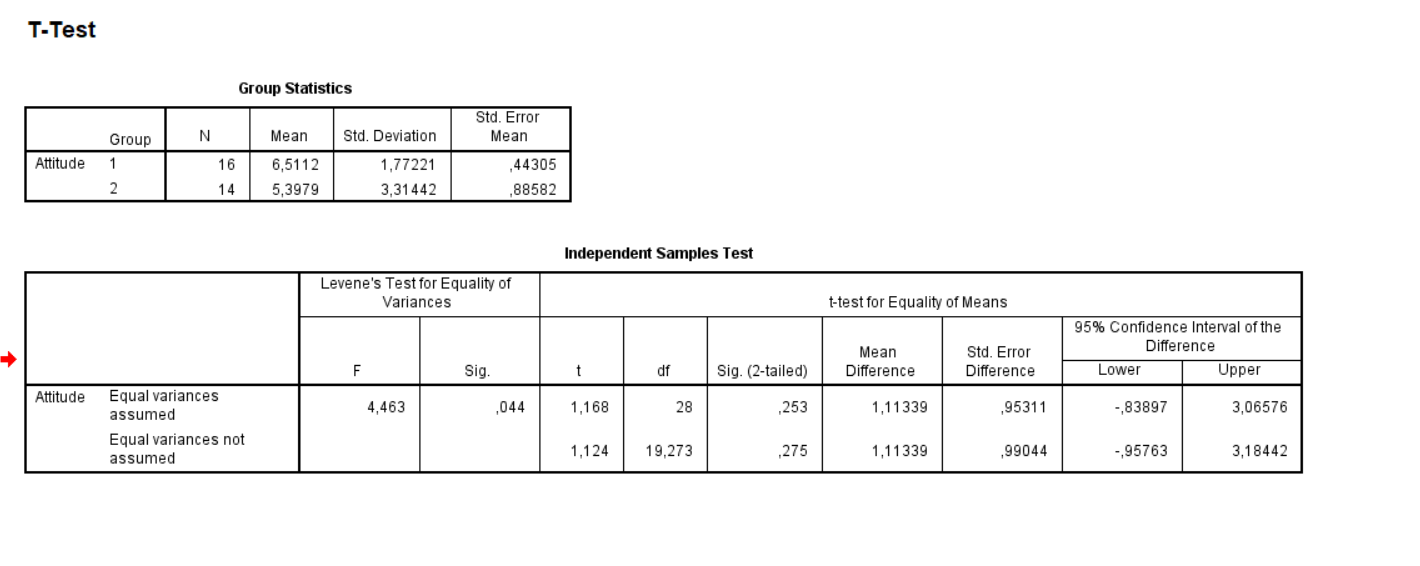
In this work, it is necessary to test the null hypothesis that urban and rural residents both have the same attitude toward gun control. Accordingly, an alternative hypothesis would be: urban and rural residents do not have the same attitude toward gun control. In this case, there are two varieties of the same test: the independent-samples t-test with equal or unequal variances. SPSS offers a test of this indicator as part of the analysis and considers both cases. Figure 1 shows the SPSS output for the data in the appendix.
Data Analysis
The interpretation of these results is as follows, according to Figure 1. Firstly, the first table presents the descriptive statistics for the two groups: the first contains 16 elements, the second contains 14. Their means differ, as well as the standard deviation, including the mean of the standard errors. Levene’s test for equality of variances in the second table shows a p-value less than 0.05, indicating a statistically significant difference in this indicator. However, SPSS provides both solutions, assuming that the variances in the groups are equal, even though they are not.
The key indicator of the second part of the second table is again significant, but other background information is also presented here. For example, the degrees of freedom (df) differ in the calculations for the two types of this test. The t value differs to a lesser extent, while the mean difference is naturally equal. However, it is the significance column that allows you to analyze whether groups differ in the attitude variable being analyzed.
In both cases, the two-tailed p-values are clearly greater than 0.05, which is the standard for such tests. It is useful to consider the second row, as Levene’s test indicated that the variances were not equal. An indicator of 0.275 in a two-sided test does not allow rejection of the null hypothesis and acceptance of the alternative, indicating no significant difference.
At the same time, in the first line, the indicator, although slightly less, is still equal to 0.253, which is noticeably more than 0.05. As a result, there is no statistically significant difference between urban and rural residents regarding their attitudes toward gun control. The null hypothesis remains valid; the alternative is not accepted.
Appendix
Table 1 – Group and Attitude Data