
Introduction
This paper proposes a statistical analysis to test a hypothesis, with results that would help improve call center operational performance. An extensive dataset of 1674 records was collected, including the protocol type (new or old), the customer’s wait time in the queue, and the total time the CSR took to resolve the customer’s request. Since the set was conditionally divided into two groups, it was interesting to investigate whether the queuing time of customers differed from 150 seconds for both the new and old protocols.
Testing the Hypotheses
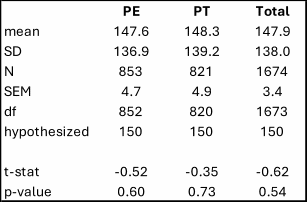
The null hypothesis postulated that the sample mean customer waiting time in the queue was equal to 150, whereas the alternative hypothesis stated that it was not. A one-sample t-test was conducted to determine whether the sample values differed from 150 seconds—the results are shown in Table 1 (Doane & Seward, 2021). The analysis was performed for the PE and PT groups and the whole sample without splitting into groups. The computational results indicate that the null hypothesis cannot be rejected, as all p-values exceed 0.05. In practice, the time a customer waits in the queue is 2.5 minutes; thus, no additional resources are required.
Table 1. Results of a one-sample t-test for customer waiting time in the queue
A similar test was conducted to determine the average time it took a CSR to resolve a customer call. However, the difference was that two samples, PE and PT, were used. The null hypothesis, in this case, postulated that there was no difference in the average time to resolve the query between the two groups.
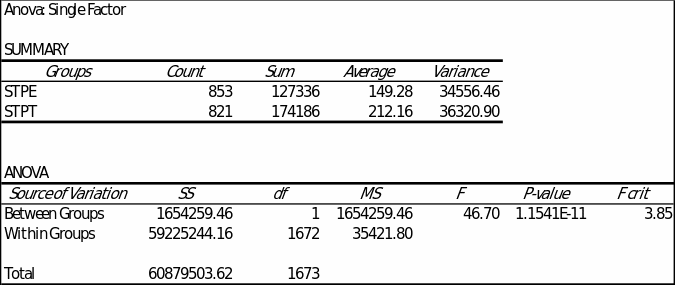
In contrast, the alternative hypothesis indicated that the average time differed between the two groups. As shown in Table 2, there was indeed a difference between the two groups (F(1,1672) = 46.70, p <.000). This implied that the group with the new protocol showed less time required to resolve the customer’s request (M = 149.3) than the traditional protocol group (M = 212.1). Hence, the new protocol is effective in accomplishing the objective.
Table 2. Results of the t-test of independent samples for time to resolve the request
Summary
This paper aimed to use inferential statistics to examine differences in the cases of one and two samples. It is important to note that conclusions drawn solely from descriptive statistics are often erroneous. For example, if a superficial analysis shows that the sample mean differs from the reported mean by a wide margin, such a conclusion may be reliable only with inferential statistics, such as t-tests and ANOVAs.
As part of this paper, a one-sample t-test and a t-test for independent samples (two-group ANOVA) were conducted to evaluate the call center data and generate recommendations of practical value to the enterprise (Liu & Wang, 2021). It was shown that the average customer waiting time in the queue was not statistically different from 150 seconds for both protocols, indicating the call center is efficient. Customers do not have to wait as long, and their satisfaction levels drop less. It was also shown that implementing the new protocol for employees reduces the average time to resolve a customer inquiry from 212.16 seconds to 149.28 seconds. This figure is below the target of 210 seconds, indicating that the new protocol is excellent at reducing CSRs’ time with the customer.
References
Doane, D., & Seward, L. (2022). Applied statistics in business and economics (7th ed.). McGraw-Hill.
Liu, Q., & Wang, L. (2021). t-Test and ANOVA for data with ceiling and/or floor effects. Behavior Research Methods, 53(1), 264-277.