Introduction
Purpose Statement
The present report was commissioned by the chief financial analyst of the Euroland Company. The primary task was to identify three investment opportunities for the client in the banking sector and assess their financial performance during the past five years using appropriate ratios. The purpose of the present report is to provide investment recommendations based on the analysis of financial performance and discuss the limitations of financial reporting based on the examples from the annual reports of the selected companies.
Company Selection and Background
The present report analyses three major British Banks, including Barclays, HSBC Holding, and Lloyd Banking Group (Rogers, 1999). The Big Four British banks dominate the UK banking industry for a number of reasons, including their longevity, aggressive marketing, and service variety (Rogers, 1999). While the stability of these banks has been proven through centuries, there is a growing concern about their sustainability.
Thus, the present report will select the most financially stable bank for possible investments. The present report utilizes earnings-per-share (EPS), debt-to-assets (D/A), and efficiency ratios. Additionally, DuPont analysis was used by calculating net profit margin, asset turnover ratio, and equity multiplier. All the calculations are provided in Appendix B, Appendix F, and Appendix J. The calculations were conducted formulas and data from the annual reports provided in the appendices (Barclays, 2017; Barclays, 2018; Barclays, 2020; HSBC, 2020; Lloyd Banking, 2016; Lloyd Banking, 2018; Lloyd Banking, 2020).
Financial Performance Analysis
Earnings per Share
EPS is a crucial indicator of a firm’s profitability, which is calculated by dividing the income available to common stockholders by the number of issued common shares (Atrill & McLaney, 2019). This metric is widely used to measure corporate value, as investors are willing to pay more for a company’s share if the EPS is high (Atrill & McLaney, 2019). Figure 1 below demonstrates the changes in EPS of the three companies under analysis for comparison.
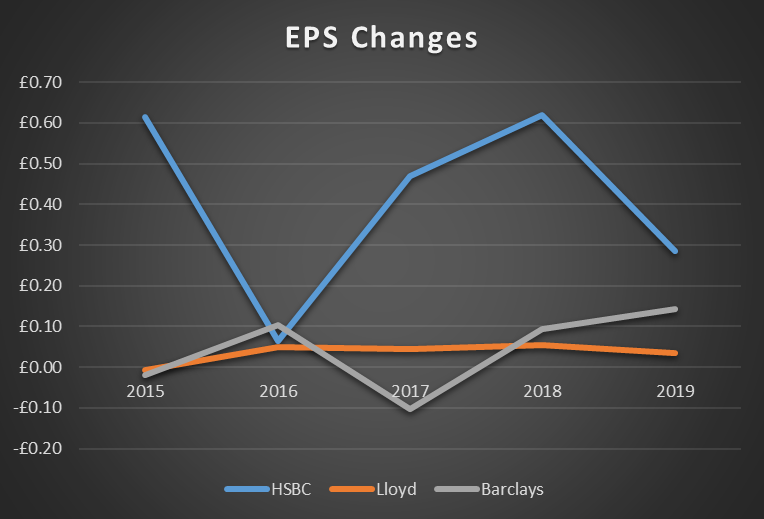
According to the analysis of trends in the EPS demonstrated above, HSBC was the leader in this aspect of financial performance for four out five past years. However, its performance was unstable throughout the past five years, which implies that investments in the company may be dangerous. The most stable performer out of the four companies was Lloyd Banking Group, as the fluctuations of the EPS were considerable for the past five years. However, it is crucial to notice that both HSBC and Lloyd Banking Group experienced a decline in 2019, while Barclays improved its performance. Thus, it is difficult to select the leader in EPS metrics among the three companies.
Debt-to-Assets Ratio
The D/A ratio is a measure of financial gearing calculated by dividing total assets by total liabilities (Atrill & McLaney, 2019). The ratio demonstrates how much of the total assets are financed by long-term and short-term debt (Atrill & McLaney, 2019). Different industries have varying tolerance for debt; however, in general, higher D/A ratio is associated with greater exposure to outside risks. At the same time, very low D/A ratio can mean that the company is slowing down its development by failing to utilize debt (Atrill & McLaney, 2019). Thus, it is crucial to compare the financial leverage of the firms in the same industry. The trends in D/A ratio of the three selected companies are provided in Figure 2 below.
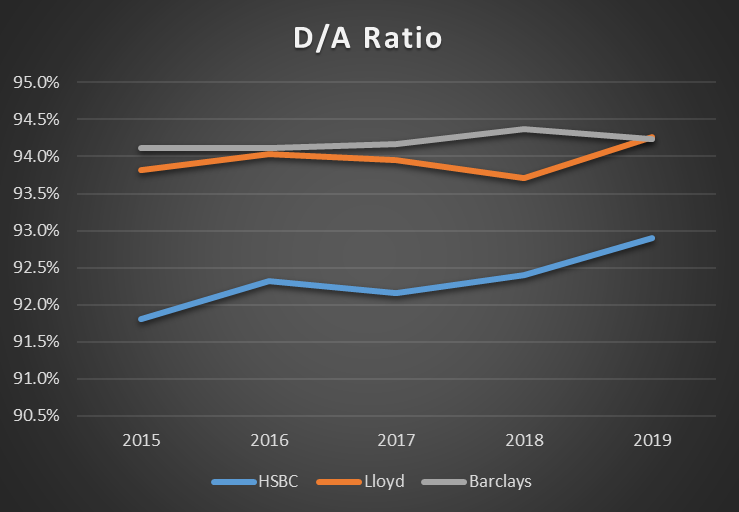
The analysis of trends pictured in Figure 2 shows that all the companies have a high level of financial leverage. HSBC had the lowest D/A ratio among its competitors, which implies that HSBC is less sensitive to changes in the outside environment. However, it is crucial to notice that HSBC’s D/A ratio has been climbing up for the past five years, with a minor decrease in 2016. At the same time, Barclays’ D/A ratio has been stable for the past five years and decreased in 2019. Thus, considering that the differences in the D/A ratio among the three firms are insignificant, it is reliable to invest in Barclays due to its consistency in terms of financial gearing.
Efficiency
Efficiency ratios demonstrate how well a company is using its assets and liabilities for internal purposes. In other words, efficiency ratios describe the quality operations (Kenton, 2020). The banking industry has a specific efficiency ratio, which is calculated by dividing operating expenses by the total revenues (Kenton, 2020). Keeping the efficiency ratio below 50% is considered optimal for banks (Kenton, 2020). Figure 3 below demonstrates the trends in the efficiency of the three banks under analysis.
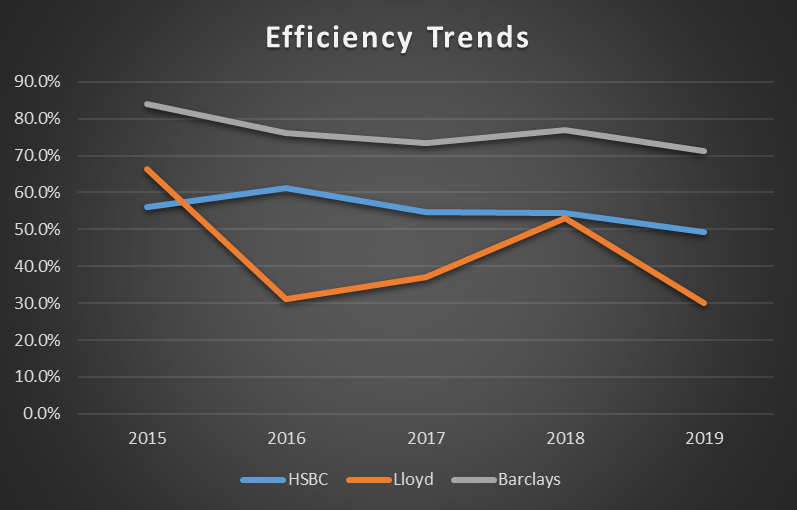
The analysis of trends demonstrates that Lloyd Banking Group is an absolute leader among the three firms in terms of efficiency. Even though its performance is comparatively unstable, Lloyd Banking Group was able to keep its operating expenses down in comparison with its revenues. Additionally, it is crucial to notice that even though Barclays’ dynamics in efficiency was positive throughout the past five years, the ratio was abnormally high, which shows that the company’s management committed little effort to address the problem. Thus, Lloyd Banking Group is a preferable option for investment considering the efficiency ratio.
DuPont Analysis
DuPont analysis is a profitability measure, which helps to decompose the return on equity (ROE). The method consists of three parts, including the net profit margin, asset turnover, and equity multiplier (Atrill & McLaney, 2019). The net profit margin is a method for quantifying profitability calculated by dividing net profit by total revenue (Atrill & McLaney, 2019). Asset turnover ratio helps to understand how efficiently a company is using its assets to generate revenue. It is calculated by dividing total revenue by average total assets (Atrill & McLaney, 2019). The ratio shows how much money the company makes per every pound in assets. Finally, the equity multiplier demonstrates how much of the assets are financed by equity. It is a method of measuring financial leverage in line with the D/A ratio. Even though not using debt to finance operations may be associated with disadvantages, using too much debt may make the company vulnerable to changes in the outside environment.
Before discussing the results of the DuPont analysis, it is crucial to assess the company’s profitability, which is included in the DuPont coefficient. The breakdown of the DuPont analysis is provided in Appendix B, Appendix F, and Appendix J. In 2019, Barclays was the most profitable bank in comparison with the two competitors, with a net profit margin of 11.4%. However, its performance through the past five years was very unstable, as it had negative profitability in 2017 and 2015. Second in terms of profitability was HSBC, while Lloyd Banking Group was the least profitable bank in 2019. While all the banks had unstable performance in terms of profitability, only Barclays had significant negative profitability two out of five years. Thus, investment in the company is associated with considerable risks.
The trends in DuPont coefficient are demonstrated in Figure 4 below.
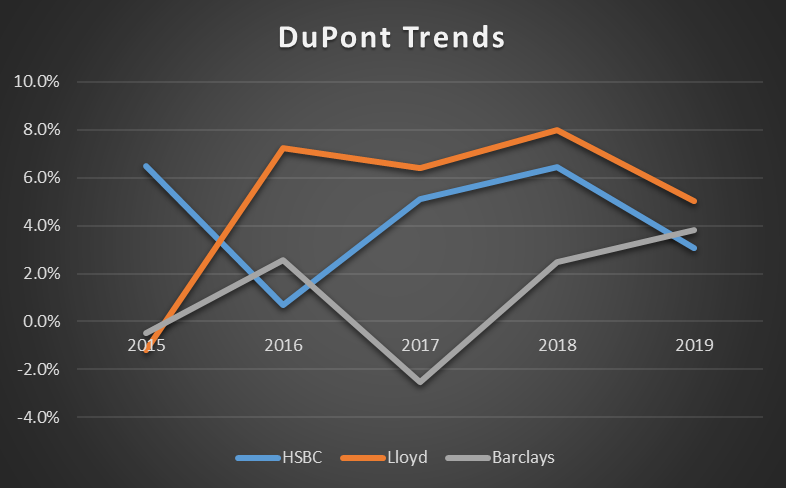
The analysis of Figure 4 shows that Lloyd Banking Group had the highest DuPont coefficient among its competitors. The company managed to keep its performance high due to stable leverage and high efficiency of operations. In 2018, when the efficiency of the company was comparatively low, it managed to improve its profitability, which kept the DuPont coefficient high. Even though Barclays managed to improve its profitability in 2019, which had a positive effect on the DuPont coefficient, its efficiency is very low to make an investment in the company reliable. Thus, DuPont analysis suggests that the Lloyd Banking Group’s financial performance was the best among its two competitors.
Investment Recommendation
Investment recommendations are usually made based on the financial performance of the companies, as it helps to make a prediction about the profitability and reliability of the investments. The analysis of the three companies provided in Section 2 of the present report demonstrated that there is no certainty about the investment decision that should be made. However, considering the results of the DuPont analysis, one can say with a significant degree of certainty that investment in Lloyd Banking Group is recommended. The company has been keeping high efficiency and sufficient profitability performance for the past five years, while its financial gearing and investment performance was comparable with its competitors. Therefore, the analysis of financial performance demonstrated that, among the three discussed options, investment in Lloyd Banking Group is recommended.
Discussion of Limitations
When assessing the recommendations, it is crucial to acknowledge the limitations of financial reporting and analysis. The financial statements are only approximation that does not give the actual financial position of the companies (Elliot & Elliot, 2019).
All the annual reports used in the present paper were prepared according to different accounting standards, which allows a certain degree of variability. For instance, same year reports of Barclays PLC and Lloyd Banking Group were prepared according to different versions of International Financial Reporting Standards (IFRS): Barclays used IFRS 10, while Lloyd Banking Group used IFRS 9 (Barclays, 2020; Lloyd Banking, 2020). Thus, there may be variations in the method used for foreign currency translation and consolidation. Such inconsistencies may influence the sensitivity of the analysis, especially if the differences in the financial performance are insignificant.
The financial statements are based on the historical costs of assets, which do not represent their current value (Elliot & Elliot, 2019). For instance, Barclays PLC’s Annual Report 2019 states that property, plant, and equipment are evaluated based on “cost, which includes direct and incremental acquisition costs less accumulated depreciation and provisions for impairment if required” (Barclays, 2020, p. 293). This implies that the current market situation is not take in consideration, which may affect the accuracy of evaluations.
There may be significant limitations in the assessment of intangible assets and goodwill. In particular, estimations of these assets may be biased, as it is based on the estimations of the individuals. For instance, according to Barclays (2020), “testing goodwill for impairment involves a significant amount of judgement” (p. 299). This implies that there may be significant inconsistencies in estimations of intangible assets, which may lead to discrepancies in the analysis.
Moreover, according to Elliot and Elliot (2019), financial statements do not take into consideration non-monetary objects that effect the efficiency of the company. For instance, the reputation of managers, co-operation of employees, and commitment to the company cannot be measured. These valuable parts of a company’s operations are not included in any of the annual reports discussed in the present paper.
Conclusion
The present report aimed at providing investment recommendations based on analysis of financial performance of three major players in the banking industry of the United Kingdom. The assessment included a historical and comparative analysis of investment, efficiency, leverage, and profitability ratios. The analysis revealed that the most reliable investment among the three companies is Lloyd Banking Group due to its high efficiency, sufficient profitability, and comparable leverage and investment performance. However, it should be noticed that before accepting the recommendations, the limitations of financial reporting and analysis should be acknowledged.
References
Atrill, P., & McLaney, E.J. (2019). Accounting and finance for non-specialists (11th ed.). London, UK: Pearson.
Barclays. (2017). Annual report 2016. Web.
Barclays. (2018). Annual report 2017. Web.
Barclays. (2020). Annual report 2019. Web.
Elliott, B., & Elliott, J. (2019). Financial accounting and reporting (19th ed.). London, UK: Pearson.
HSBC. (2020). Annual report 2019. Web.
Kenton, W. (2020). Bank efficiency ratio. Web.
Lloyd Banking. (2020) Annual report 2019. Web.
Lloyd Banking. (2018) Annual report 2017. Web.
Lloyd Banking. (2016) Annual report 2015. Web.
Rogers, D. (1999). The Big Four British banks. London, UK: McMillan.
Appendices
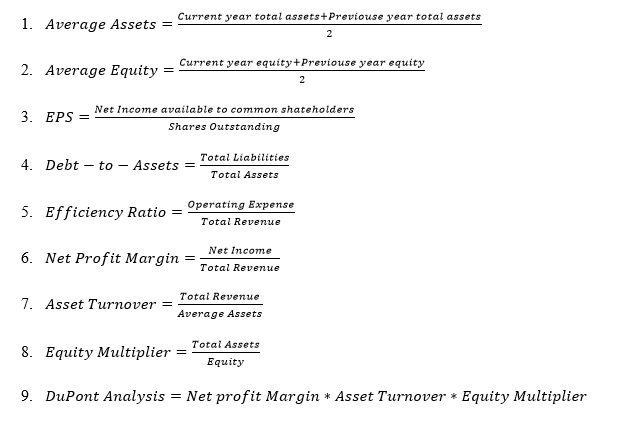
Appendix A: Formulas Used for Ratio Calculations
Appendix B: Barclays Ratio Calculations
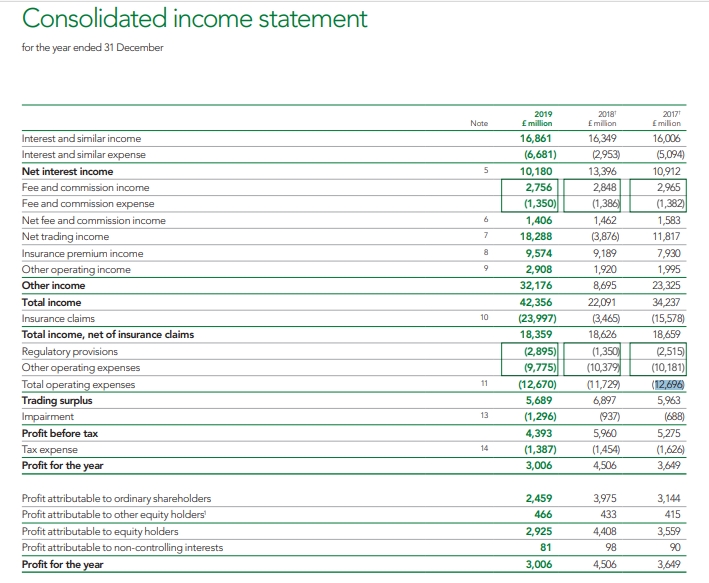
Appendix C: Barclays Consolidated Income Statement
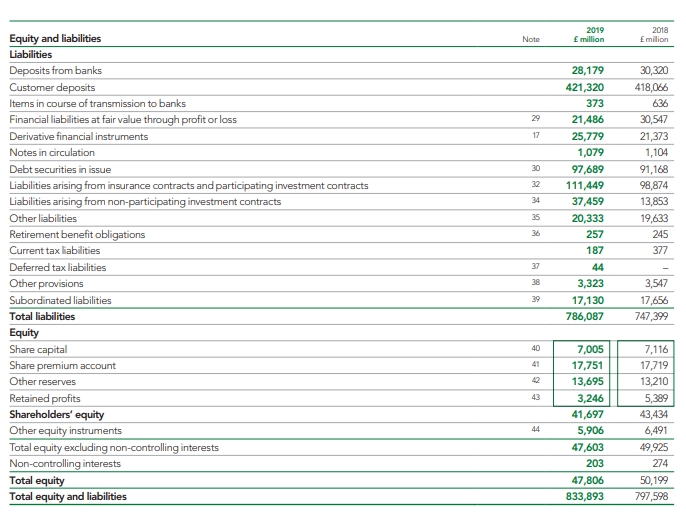
Appendix D: Barclays Consolidated Balance Sheet
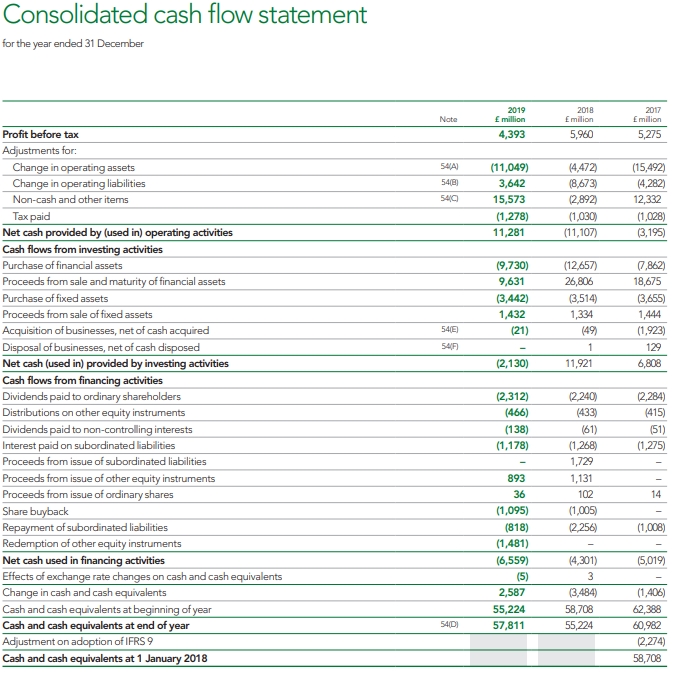
Appendix E: Barclays Consolidated Cash Flow Statement
Appendix F: Lloyd Ratio Calculations
Appendix G: Lloyd Banking Consolidated Income Statement
Appendix H: Lloyd Banking Consolidated Balance Sheet
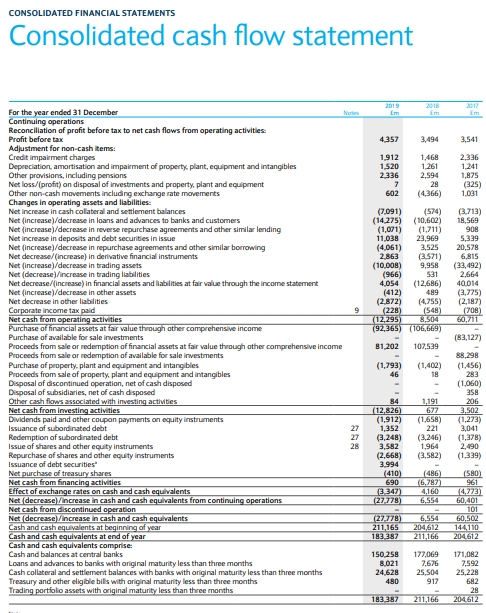
Appendix I: Lloyd Banking Consolidated Cash Flow
Appendix J: HSBC Ratio Calculations
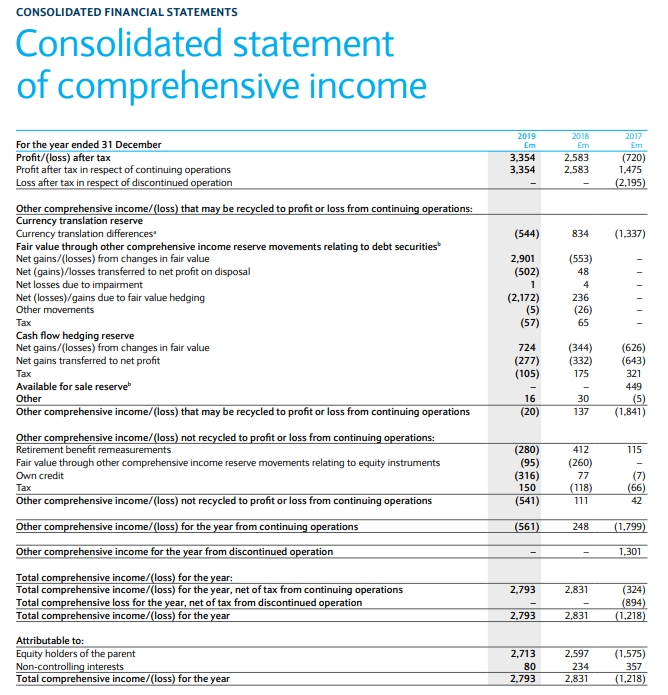
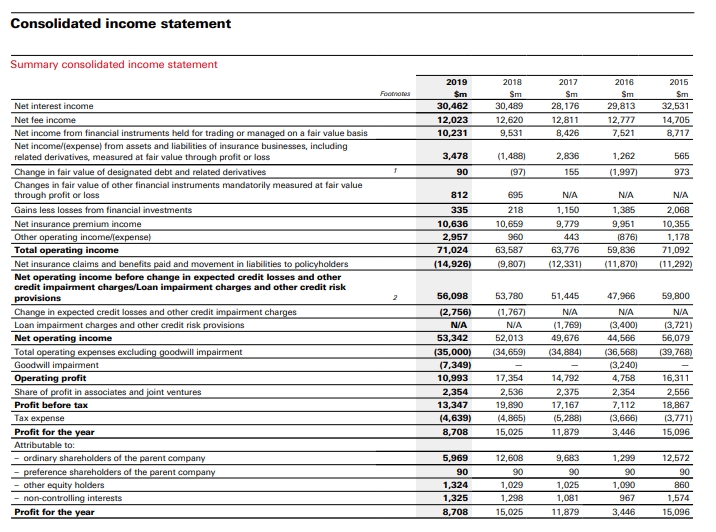
Appendix K: HSBC Consolidated Income Statement
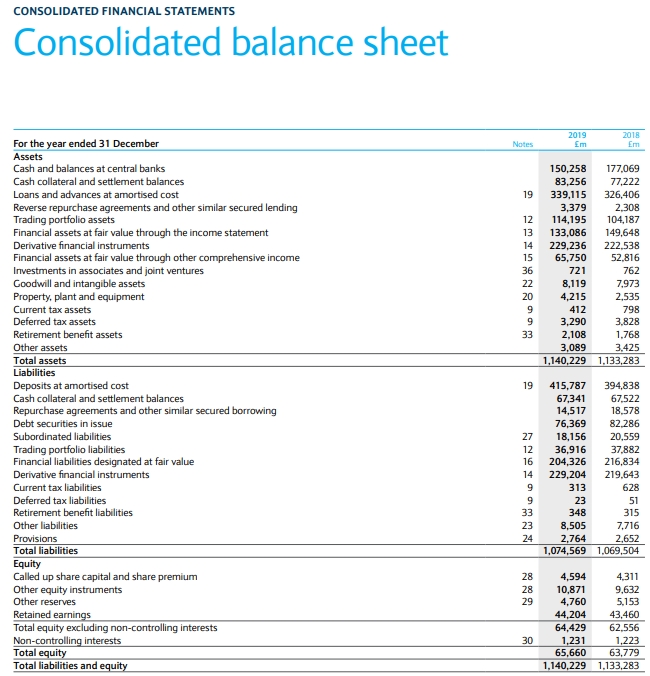
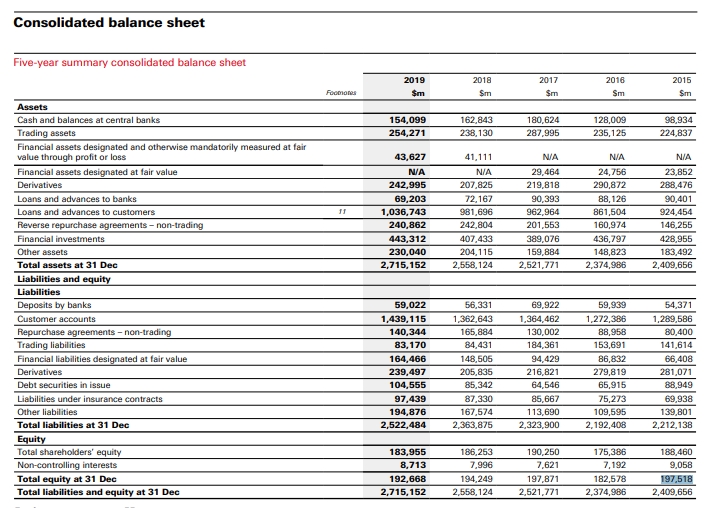
Appendix L: HSBC Consolidated Balance Sheet
Appendix M: HSBC Cash Flow