Introduction
Johnson & Johnson is a multinational corporation with dozens of brands producing mainly pharmaceutical and consumer health goods. The company was founded in 1886 by pharmacist Robert Wood Johnson and his two brothers (Reed, 2020). Eight years after its foundation, Johnson and his brother started the first line of products for mothers and infants. The company’s reputation began to grow since its sanitation products were mass-produced and thus more available. In 1921, Johnson & Johnson released its signature product – the Band-Aid (Reed, 2020). Over the next three decades, the organization established its present-day corporate structure when Robert Wood Johnson II decentralized Johnson & Johnson, transforming it into a union of companies, each with a specialization (Reed, 2020). In 1944, the company became public, allowing its shares to be traded (Reed, 2020). Fifteen years later, Johnson & Johnson began acquiring pharmaceutical research organizations, allowing the company to develop its core product – Tylenol (Reed, 2020). Thus, in the second half of the last century, the company focused on medical research and development, and it remains its primary interest today.
Pharmaceutical manufacturing is a vital and continually growing industry. In developed countries, it benefits from a considerable aging population. In developing ones, the emerging middle class provides the industry with growing opportunities. Furthermore, the scientific and engineering progress that occurred over the last decades maintains the industry’s growing technological needs (Lee et al., 2015). Pharmaceutical companies explore methods to enhance quality and process efficiency – continuous manufacturing is the current trend (Lee et al., 2015). On the other hand, the industry’s manufacturers experience pressure to innovate and accelerate their processes continually.
Pharmaceutical manufacturing is a highly competitive industry, where companies compete to develop and commercialize more efficient products. Johnson & Johnson produces a wide variety of products, including Band-Aid, face washes, baby powder, contact lenses, medicine, coronary stents, and many others. The company is one of the leaders in pharmaceutical manufacturing. Johnson & Johnson’s primary competitors are Pfizer, Roche, Novartis, AstraZeneca, Bristol Myers Squibb, Procter & Gamble, and Merck.
Financial Analysis
Liquidity Ratios (Current & Quick)
Johnson & Johnson’s current ratio is approximately 1.48, compared to 2.44 five years ago. While 1.48 is still an acceptable current ratio, the change in contrast to 2015 indicates that its ability to pay existing debts somewhat declined (NASDAQ, 2020). Johnson & Johnson might have faced this gradual decrease as a result of growth in its total liabilities over recent years. Despite the decline, the ratio still demonstrates Johnson & Johnson’s financial strength.
Similar to the current ratio, the company’s quick ratio has also decreased over the last decade. Johnson & Johnson’s quick ratio declined from its previous decade’s maximum of 2.68 to 1.24 in 2020 (NASDAQ, 2020). Even though 1.24 is considered a standard quick ratio, the tendency to decline possibly indicates that Johnson & Johnson’s ability to pay its obligations quickly is not overly promising.
Debt Ratio
The ratio is instrumental in understanding how the company uses debt to finance its activity. At present, Johnson & Johnson’s debt ratio is approximately 0.22, indicating that it has more assets than debt (NASDAQ, 2020). Generally, a debt ratio lower than one is considered relatively healthy, and the lower it is, the better profits an organization can obtain. The rate helps establish risk levels, and in the case of Johnson & Johnson it shows that it is not problematic for the organization to repay its debt.
Total Asset Turnover Ratio
Assents is an indispensable element in securing that an organization can operate adequately and its organizational expenses. In this regard, total asset turnover refers to the organization’s ability to generate high returns on its assets. Johnson & Johnson’s annual total asset turnover is approximately 0.5 (NASDAQ, 2020). Whether the ratio can be considered reasonable depends on a particular industry. It appears that for the pharmacological industry, a total asset turnover of 0.5 indicates that the company can obtain a high margin of revenue over its assets.
Price/Earnings Ratio
The price/earnings ratio is commonly employed in estimating a stock’s value. The ratio is also helpful in establishing whether a stock is overpriced or underpriced. A high price/earnings ratio is generally believed to indicate that stock might be overpriced, while a lower one shows that it might be underpriced. Higher price/earnings ratios could also signal that a company is regarded as more perspective compared to its industry peers since stock buyers are ready to pay more. Currently, Johnson & Johnson’s P/E ratio is about 18.3 (NASDAQ, 2020). Whether the rate is high or low depends on the industry’s average.
EBITDA
The ratio provides a rough estimate of an organization’s cash flow. EBITDA shows the financial performance, excluding the influence of the effect of the capital structure (i.e., interest paid on borrowed funds), tax rates, and amortization policy of an organization. In 2019 Johnson & Johnson’s EBITDA was declining and constituted $25.012B (NASDAQ, 2020). Yet, in 2020 the indicator increased to $26.553B, demonstrating an improvement in its overall financial performance (NASDAQ, 2020). EBITDA is also widely used as a component of various financial performance ratios.
Price/Cash Flow Ratio
The application of the ratio is dependent on a specific company, particularly its non-operating expenses. Cash flow values are significant in fundamental valuation and credit analysis. Presently, Johnson & Johnson’s price/cash flow ratio is around 18.19. In the autumn, it reached its maximum at 21.4 in 2008 and recently began to decrease slightly (NASDAQ, 2020). Although the optimal price/cash flow ratio does not exist, similarly to the price/earnings ratio, the company’s indicator seems relatively high, potentially signaling that its stock is slightly overpriced. Nevertheless, its meaning depends on Johnson & Johnson’s competitors.
Market-to-Book Ratio
The market-to-book ratio or price-to-book is needed to determine whether the company’s stock price is valued adequately. Johnson & Johnson’s market-to-book ratio is at 5.9, demonstrating a continuous steady growth for more than a decade (NASDAQ, 2020). Yet, it dropped a bit from 6.05 in 2019 (NASDAQ, 2020). Comparably to the price/cash flow and price/earnings ratios, this indicator shows that Johnson & Johnson’s stock price is trading at a significantly higher price than its book value. The price-to-book ratio suggests that Johnson & Johnson might receive a high return on its assets or that its stock price might be overpriced.
Times Interest Earned Ratio
The times interest earned ratio concerns a company’s debt obligations. The ratio is essential for determining whether a company can honor its debt obligations based on its revenue. Johnson & Johnson’s time interest earned ratio experienced growth last year and presently constitutes approximately 97 (NASDAQ, 2020). The increase positively correlates with the company’s security insolvency, which is favorable for creditors and investors. The company’s current times interest earned ratio shows its capacity to fulfill the interest obligations.
Return on Total Assets
Return on total assets helps to establish how efficiently Johnson & Johnson uses its assets to produce income. The ratio remained more or less consistent for two years and now is almost at 11%, which can be considered a good indicator compared to 2017-2018 when the ratio was around one percent (NASDAQ, 2020). Return on total assets facilitates understanding the connection between a company’s assets and revenue. Hence, it can be concluded that Johnson & Johnson has continuously used its resources in an efficient manner.
Profit Margin on Sales Ratio
Currently, Johnson & Johnson has a relatively high-profit margin. Since 2018, the company’s profit margin rose to around 21% (NASDAQ, 2020). In 2017 and the beginning of 2018, it was at a record low of 1.78% (NASDAQ, 2020). Nevertheless, the company did not manage to reach the same level as in 2014, when its profit margin was 23.27 (NASDAQ, 2020). A high-profit margin shows leaders in an industry, and in Johnson & Johnson’s case, it indicates its competitive advantage.
Competitive Benchmarking
The company under consideration is among the leading in the Zacks Large Cap Pharmaceuticals industry. Nevertheless, in some aspects, it is less competitive than its industry peers. Bristol Myers Squibb, Merck, Novartis, Pfizer, and Procter & Gamble are giants in the pharmacological industry and Johnson & Johnson’s principal competitors. For instance, the company’s P/E ratio is not one of the highest. Pfizer and Novartis have somewhat higher indicators – 25.3 and 29 correspondingly (NASDAQ, 2020). On the other hand, Merck has a lower P/E ratio – 17.9. Based on the ratio, it could be said that compared to some of its industry peers, Johnson & Johnson is regarded as less perspective. Unlike P/E, the company’s market-to-book ratio is somewhat lower than Merck’s (5.9 and 7.1), but the difference does not seem overwhelming. Based on this indicator, Johnson & Johnson performs moderately well (NASDAQ, 2020). Regarding the current ratio, Johnson & Johnson and its competitors have similar indicators: while Johnson & Johnson’s current ratio is approximately 1.48, Pfizer and Merck have comparable results – 1.4 and 1.3 correspondingly. The only exceptions are Novartis and Procter & Gamble – their current ratio is below one.
The quick ratio situation is comparable, while Johnson & Johnson’s rate is one of the highest, Novartis, Procter & Gamble, and Merck’s quick ratios are below one, and Pfizer’s is 1.13. Bristol Myers Squibb is the leader’s group with a slightly higher quick ratio of 1.27. Johnson & Johnson’s total asset turnover is also among the highest (NASDAQ, 2020). In comparison, Merck (0.14), Novartis (0.1), and Bristol Myers Squibb (0.32) seem to perform relatively poorly (NASDAQ, 2020). Hence, as per the industry’s average, Johnson & Johnson performs well in this aspect. While based on the price/cash flow ratio, the company’s stock is somewhat overvalued, the stock of its competitors is mostly undervalued. Novartis’s price/cash flow ratio (15.91) is below the industry’s average and Johnson & Johnson’s indicator (NASDAQ, 2020). Bristol Myers Squibb (12.90) is in the same situation. On the contrary, Merck’s price/cash flow is higher than Johnson & Johnson’s and constitutes 19.12.
Current Events Impacting the Company
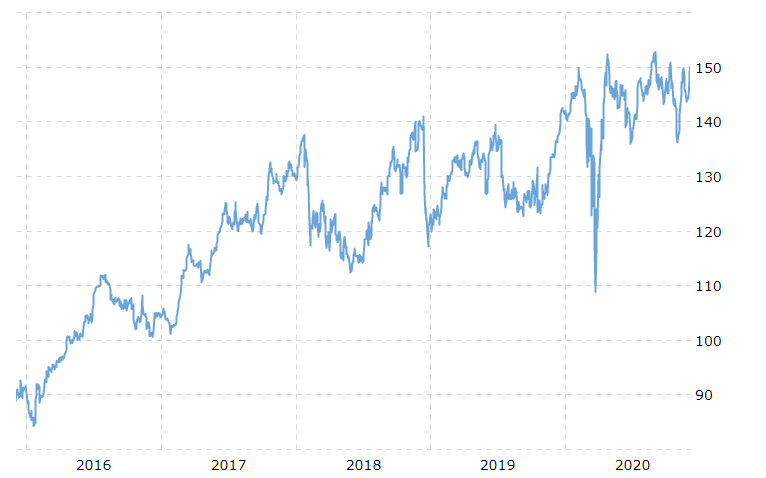
The most significant current event for Johnson & Johnson is the pandemic. At the beginning of this year, the company’s stock dropped significantly – from $146 to $112 (Trefis Team, 2020). The restrictions on non-urgent medical producers, to an extent, caused it. A sizeable portion of the company’s products is used in elective surgeries, which have been postponed for months globally. Consequently, in the second quarter, Johnson & Johnson experienced a 34% drop in the sector of medical devices (Trefis Team, 2020). On the other hand, some of Johnson & Johnson’s products’ popularity spiked; for instance, Tylenol and Listerine sales increased in the first quarter. Regarding the decline of the company’s stock price, the federal government’s economic stimulus helped it recover (Ozaist, 2020). Johnson & Johnson’s historical stock prices can be seen in Figure 1 (NASDAQ, 2020). Due to the federal stimulus, Johnson & Johnson’s stock almost regained its pre-pandemic rate and grew by 30%.
Furthermore, the partial reopening of the economy encourages the growth of the company’s stock. As the lockdown restrictions are gradually lifted, healthcare facilities start managing the postponed elective surgeries (Ozaist, 2020). The drop of 34% in the company’s medical devices sector improved to a mere 3.6% drop in the third quarter (Trefis Team, 2020). In the light of the improvement, Johnson & Johnson predicted its full-year revenue forecast to be around $7.95–$8.05 per share, which was previously thought to be $7.75-$7.95 (Trefis Team, 2020). The softening of the lockdown leads to growth in hospital visits, prescriptions, and procedures, which is favorable for the company (Ozaist, 2020). Additionally, some of Johnson & Johnson’s essential medications increased their market share. Thus, Imbruvica, Darzalex, and Stelara are projected to gain 60% growth in sales in 2022 (Trefis Team, 2020). The lifting of the lockdown and the federal government’s help prompted the company’s stock growth.
Another pandemic-related development that can considerably impact Johnson & Johnson’s stock is a vaccine. Unlike some of its competitors, Johnson & Johnson’s vaccine is one-shot, which gives it a competitive advantage (Trefis Team, 2020). The company prepares to resume its vaccine trials since it has been put on pause as a result of a participant’s unexplained illness. The successful development of a one-shot vaccine could encourage the company’s stock growth next year.
Recommendations Regarding Johnson & Johnson’s Stock
In conclusion, whether Johnson & Johnson’s stock is worth buying, is complicated by its financial performance, public image, and metrics. Based on the CAMP model, the company’s expected rate of return is 9.13%. Considering it is above the security market line, its stock can be regarded as underpriced. The company’s price/earnings ratio, which is lower than its competitors, supports the idea. At the same time, Johnson & Johnson’s price-cash flow ratio suggests that its stock is overpriced since the rate is somewhat higher than the industry’s average. Experts also cannot reach a consensus on whether the stock is worth buying. Some suggest that due to the litigation risk linked to asbestos found in baby powder and the postponement of vaccine production, the stock is not a buy (Gatlin, 2020). Others claim that while some of the company’s ratios signal that the stock is overpriced, Johnson & Johnson’s financial health and high profitability indicate that it is a buy (Cohne, 2020). The recommendation regarding buying the company’s stock seems to be a point of disagreement.
Overall, despite the asbestos scandal, several financial indicators, and postponement of vaccine production, Johnson & Johnson’s stock might be worth buying. Based on the outlined in the text metrics, the company is financially healthy, trustworthy, and highly profitable. The potential production of the COVID-19 vaccine next year can also help Johnson & Johnson’s stock rise. Hence, the company’s stock can be considered a buy for investors searching for stable returns.
References
Lee, S. L., O’Connor, T. F., Yang, X., Cruz, C. N., Chatterjee, S., Madurawe, R. D., & Woodcock, J. (2015). Modernizing pharmaceutical manufacturing: From batch to continuous production. Journal of Pharmaceutical Innovation, 10(3), 191–199.
Reed, E. (2020). History of Johnson & Johnson: Timeline and facts. The Street.
Cohne, D. (2020). Is Johnson & Johnson (JNJ) a buy, sell or hold?. Stock News.
Ozaist, L. (2020). The impact of COVID-19 on a company: 6 Questions for the Chief Financial Officer of Johnson & Johnson. Johnson & Johnson.
Gatlin, A. (2020). Is JNJ Stock a buy as it ramps Coronavirus vaccine testing efforts?. Investors’ Business Daily.
Trefis Team. (2020). What’s happening with Johnson & Johnson stock?. Forbes.
NASDAQ. (2020). Johnson & Johnson (J&J). Yahoo Finance.