Introduction
This paper analyzes the individual financial ratios of KFC, McDonald’s, and Chipotle. This report will provide a comparative analysis of such ratios as profitability ratio, liquidity ratio (current ratio), and financial leverage. Initially, the background of each analyzed business will be given, indicating the problems that could potentially negatively affect the performance of the companies. At the end of the paper, a conclusion is presented on the general position of each organization, made based on the analysis carried out. This report will highlight the weaknesses of the businesses presented here and show what environment one need to focus on to improve their position.
KFC
Formerly known as Kentucky Fried Chicken restaurants are now better known by their short name KFC. They gained their popularity in the middle of the twentieth century, even before their main competitors, the equally famous McDonald’s. KFC has been focusing on chicken dishes for decades. They differ in a large number of seasonings; the main recipe for the famous chicken is a trade secret. Despite the fact that KFC offers chicken dishes, they have a significant impact in the fast food segment, even competing with hamburgers.From the beginning of the network’s creation, KFC’s head office still operates in Louisville, Kentucky.
The formation of KFC as a powerful international trademark is connected with the success of the first partners. The first franchise agreement was with Pete Harman in 1952, which allowed him to use KFC’s recipes, as well as their trademark and owner’s logo (Chandler, 2019). The Utah community responded positively to the change, boosting Harman’s revenue by 75% (Chandler, 2019). The name of the franchise also had its impact on the popularity growth, as it emphasized that the new chicken recipe was different from the “southern chicken” familiar to the population..
The biggest challenges in the area in recent years have been government changes to COVID-related restrictions and staffing and supply issues facing KFC. The staffing, customer service, and chicken shortage issues that plagued the popular restaurant throughout 2022 were ranked the 14th most challenging (Ostrowska-Tryzno & Pawlikowska-Piechotka, 2022). The variety of issues that KFC has faced in a short time, combined with poor consumer and media response, have created an issue affecting the brand’s reputation and revenue.
McDonald’s
With the advent of cars, cafes for drivers began to spring up everywhere, especially in California: servers served customers who always stayed in their cars. McDonald’s joined the race for customers in 1940, and within 10 years, their establishment began to thrive and become popular with young people (Chandler, 2019). However, in 1948 the brothers decided to take the lead and undertook several significant innovations (Chandler, 2019). By laying off the old wait staff, they could lower prices through savings on wages and open two windows through which customers ordered their food from a new small menu. The main bait was a 15-cent hamburger; for comparison, in all cafes of this kind, a hamburger costs about 30 cents (Chandler, 2019).
At the same time, the annual income of the McDonald brothers was $ 300,000 a year, which was a huge amount for fast food (Walker, 2022). Thus, the one-of-a-kind manner of service made the enterprise even more successful. In 1961, owning 228 restaurants throughout the United States, Kroc bought out the brothers’ share for $ 2.7 million (Our history, n.d.). At the same time, the head of McDonald’s, Ray Kroc, adhered to the principle that it was necessary to quickly serve, feed the customer and let him go so that the halls were filled with new customers.
McDonald’s has announced that it will make significant changes to its franchising policy. The planned changes have not been well received by a significant portion of McDonald’s franchisees in the US, which operate some 13,000 locations across the states (Our history, n.d.). The McDonald’s National Alliance of Franchise Leaders was not inspired by the proposed changes and, due to various concerns, asked for an extension to the implementation of the new policy (Simpson, 2022). This was due to the fact that external factors, such as the closure of part of the restaurants, had already presented franchise owners with a number of problems.Possible dissatisfaction of partners can negatively affect the performance of the entire business.
Chipotle
In 1993, with his father’s moral and financial support, Steve Ells opened the first Chipotle Mexican Grill in Denver, Colorado. Today, Chipotle Mexican Grill is one of the sustainable means of the American economy, a company with more than 2000 points in North America and European countries (Germany, France, Great Britain). It provides jobs for 59,330 employees. The chain’s market capitalization is estimated at $11.78 billion.
In 1996, McDonald’s became the important investor in Chipotle Mexican Grill. However, in 2006, McDonald’s decided they needed to shift their focus to developing their own brand and chain, so they stopped their investment (Loutskina & Ritchie, 2020). Over 8 years of cooperation, the company invested $360 million in Chipotle, and the total profit of McDonald’s in the alliance with Chipotle was $1.5 billion (Loutskina & Ritchie, 2020). At the time of parting, there were already 500 eating places in the Mexican restaurant chain. After exiting from McDonald’s, Chipotle Mexican Grill bought out what little of its restaurants operated under the franchise scheme. Since then, they do not work on franchising, and all networks are under corporate management.
The pandemic has been difficult for the restaurant business, and Chipotle has had to deal with many of the same hardships seen elsewhere in the economy. First of all, this includes problems with hiring, rising prices, layoffs and strikes of workers due to wage cuts, and much more. Problems also come from clients who have succumbed to the worldwide pandemic’s effects.
Return on Equity
Table 1
Return on Equity = Net Income / Shareholders’ Equity
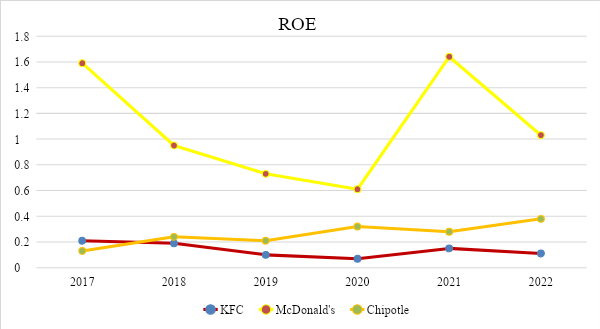
Return on equity is a measure of net income compared to an organization’s equity. Unlike the similar indicator, ‘return on assets,’ this indicator characterizes the efficiency of using not the entire capital (or assets) of the organization but only that part of it that belongs to the owners of the enterprise (Sekhon & Kathuria, 2019). The return on equity is able to give an idea to the investor or its specialists how successfully the company manages to keep the return on capital at the proper level and thereby determine the degree of its attractiveness for investors (Marshall et al., 2014).
The above calculations show a steady increase in McDonald’s return on equity, which started strong compared to the other two companies. Although McDonald’s has also weathered the COVID-19 crisis, the business can be seen to bounce back and even increase profits quickly. As for KFC, the company has shown a solid return on equity over the past five years, having only experienced losses in crisis years like 2019 and 2022. While McDonald’s and KFC were going through a post-COVID crisis, the revenue of one of their smaller competitors, Chipotle, has remained at about the same rate over the past 5 years, even experiencing an increase while other businesses were going through a crisis. The increase in the company’s efficiency was due to a decrease in the cost of delivery but, at the same time, an increase in prices on the menu. Thus, it can be noted that since 2020, only one company has experienced a constant rise in profits.
Liquidity Ratio (Current Ratio)
Table 2
Current Ratio = Current Assets / Current Liabilities
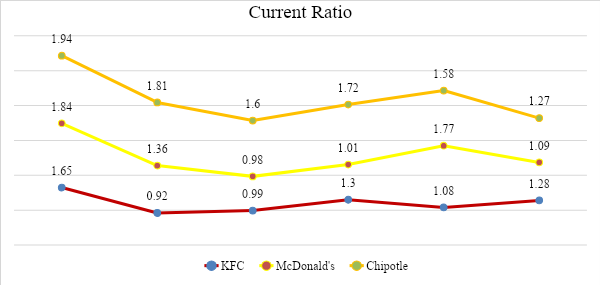
The current (total) liquidity ratio characterizes the solvency of the organization and the ability to repay current liabilities. The logic of calculating this indicator is that the company repays short-term liabilities mainly at the expense of current assets (Marshall et al., 2014). Therefore, if they exceed current liabilities in value, the enterprise can be considered as successfully functioning (Dimitrova, 2020). Many indicators have recommended norms, and liquidity also has average standards: a result close to 1.5-2 is considered acceptable.
As can be seen from Chart 2, none of the three companies analyzed in this report exceeds an acceptable or “good” result. Although all three companies show approximately similar performance, it can be seen that KFC has the lowest odds. As the ratio comparison shows, a smaller KFC ratio indicates that the company has more financial obligations than it can handle. That is, in comparison with Chipotle and even McDonald’s, the company is more unstable and less solvent. Although showing similar results to KFC, McDonald’s still tends to approach the norm. As for Chipotle, it can be seen that over the past 5 years, the coefficient has fallen for the first time to the indicated standard, but not critically; in general, the company was within the normal range throughout the entire analyzed period.
Quick Ratio
Table 3
Quick Ratio = (Total Current Assets – Inventory + Prepaid Expenses) / Current Liabilities
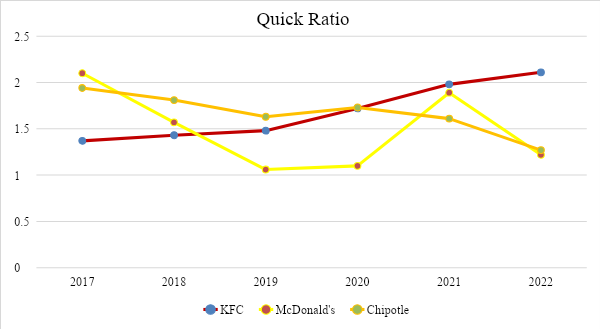
The quick liquidity ratio makes it possible to determine what part of the current (short-term) debt of a legal entity can be repaid by it at its own expense in a short time. A coefficient in the range of 0.7-1 is considered normal (Abel, 2018). Lower values, especially if the figures relating to receivables predominate in the calculation, will be unfavorable. The only time when the indicator of the analyzed companies fell and became close to 1 was in 2019 at McDonald’s. Although the indicator remained at an acceptable level, this could increase the risk that highly and quickly liquid assets were not enough to pay off debts during the pandemic fully. However, the business promptly raised the ratio, and the very next year, 2020, highly liquid assets covered all current debt. In general, all three companies have a coefficient above 1, which indicates that it is possible to cover all current debts at the expense of available funds while some of them will still remain at the disposal of the enterprise.
Assets Turnover
Table 4
Asset Turnover Ratio = Revenues / Assets
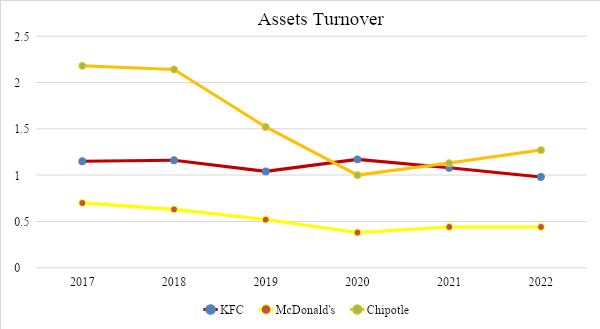
The asset turnover ratio allows one to evaluate the efficiency of using all the assets of the enterprise, regardless of the source of their formation. In addition, the definition of the resource return ratio clearly shows how much profit a company receives from every dollar invested in assets (Abel, 2018). A higher asset turnover is desirable, as Chipotle is showing, well ahead of its competitors. However, in 2019, asset turnover decreased significantly due to a change in the policy for accounting for assets under operating leases. Based on the analysis of the current business for those years, the assets turnover should have been kept in the range of 1.2. However, the crisis of the COVID-19 pandemic had a negative impact, which is why the low level of asset turnover remains but tends to increase. Low turnover at McDonald’s may indicate the underutilization of assets. In addition, in recent years, starting from 2020, there has been a decrease in the coefficient, mainly due to an increase in other assets, such as goodwill. Based on the data presented in the diagram, it can be seen that KFC shows average results among the enterprises analyzed in the article while maintaining a fairly high asset turnover ratio. It is important to note that the turnover depends on the rate of return on sales: with a high profitability, the turnover of assets is usually lower, and with a low rate of return, it is higher (Marshall et al., 2014).
Debt to Asset Ratio
Table 5
Debt to Asset Ratio = Total Debts / Total Assets
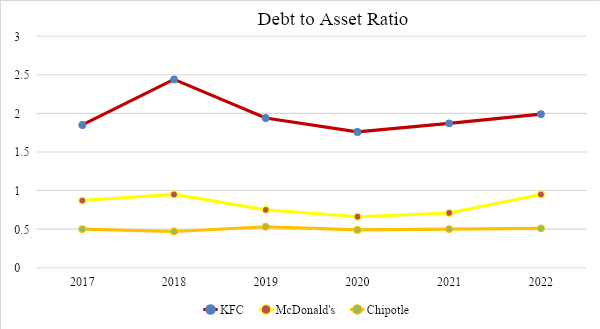
The ratio of debt to total assets shows how much of the business is owned by creditors compared to how much of the company’s assets are owned by shareholders. Debt capacity reflects both a company’s ability to service its current debt and its ability to raise cash from new debt if needed. Interestingly, Chipotle, the only non-franchise in this analysis, performs close to McDonald’s. KFC has had the highest performance in the last 5 years compared to the other two businesses. The higher the ratio of a company’s debt to total assets, the higher its leverage. Companies that are highly leveraged face a greater risk of default if their earnings decline and find it harder to raise new debt to weather a downturn. As a comparison of the ratios shows, Chipotle’s lower result indicates that the company has the lowest percentage of debt.
Interest Coverage Ratio
Table 6
Interest Coverage Ratio = Operating Profit / Interest Expense
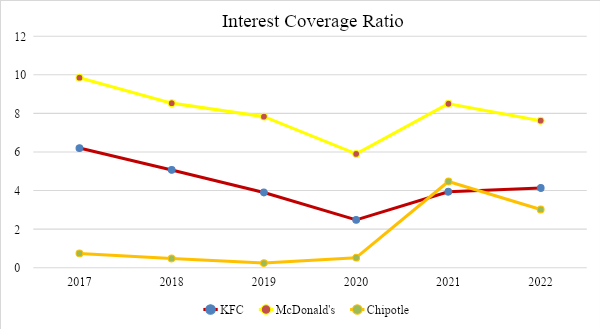
The interest coverage ratio characterizes the organization’s ability to service its debt obligations. The lower the interest coverage ratio, the higher the organization’s credit burden and the higher the likelihood of bankruptcy. Interestingly, McDonald’s usually experiences a crisis the year after the event itself. For example, one can also see here that Chipotle had a significant drop in numbers, which happened to McDonald’s the following year after the COVID-19 pandemic (2020). The higher the interest coverage ratio, the more stable the organization’s financial position. As can be seen from the graph, companies such as KFC have the most stable position, and McDonald’s largely outperforms Chipotle. It is especially noticeable in 2019 when companies approached a critical situation close to bankruptcy during the pandemic. A ratio below 1.5 calls into question the organization’s ability to service its debt.
Return on Assets
Table 7
Return on Assets = Net Income / Total Assets
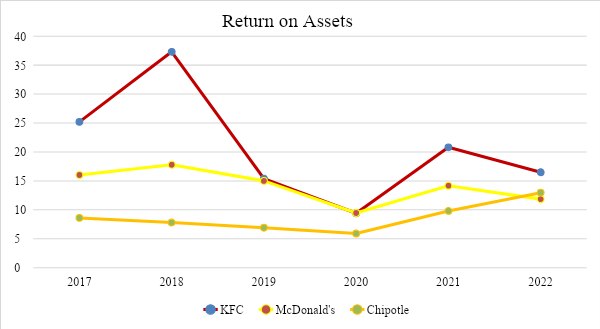
Return on assets (ROA) is an indicator that characterizes the return on the use of all the organization’s assets. Return on assets shows how much net profit the organization receives per unit value of all assets (capital). The graph shows that each of the three companies analyzed in this report has a good investment return. At the same time, a significant value gap between companies can be traced since KFC has an average coefficient twice that of Chipotle and is close to McDonald’s. However, KFC experienced a big decline between 2018 and 2019 due to restaurant refranchising and the chicken shortage crisis caused by logistical problems. It led to the temporary closure of many outlets around the world. Chipotle has improved its margins for two years, even compared to McDonald’s. However, as can be seen from the data above, every business suffered losses in 2019-2020 as it was necessary to recover from the crisis in 2019 caused by the pandemic.
Conclusion
All companies presented in the report are world famous in the field of the fast food business. Based on the analysis, it can be concluded that KFC has suffered the least crisis in the last 5 years since their average indicators remained in the same position. Thanks to its stable development and high rates of return on assets, the business can become attractive for investment due to its stability. Although in terms of performativity and profitability, KFC is sometimes significantly inferior to the other two competitors. McDonald’s shows high business profit ratios and average investor appeal among the companies described. In the analyzed period, Chipotle shows mostly positive growth and a relatively strong position in the market. Although a company can be affected by environmental crises, it can also effectively regain its position and continue to grow relentlessly, which can be traced through indicators such as interest coverage ratio or asset turnover ratio. Thus, the crises of 2019 and 2022 became the main problems for the environment; however, companies continue to show rapid reactions and continue to grow.
References
Abel, A. B. (2018). Optimal debt and profitability in the trade-off theory. The Journal of Finance, 73(1), 95–143. Web.
Chandler, A. (2019). Drive-thru dreams: A journey through the heart of America’s fast-food kingdom. Flatiron Books.
Loutskina, E., & Ritchie, R. (2020). Chipotle: Capital Structure Decision. SSRN Electronic Journal. Web.
Marshall, D. H., Viele, D. F., & McManus, W. W. (2014). Financial Statement Analysis. In Accounting: What the numbers mean (pp. 420–458). McGraw-Hill Irwin.
Ostrowska-Tryzno, A., & Pawlikowska-Piechotka, A. (2022). Gastronomy tourism and the COVID-19 pandemic crisis. Sport i Turystyka. Środkowoeuropejskie Czasopismo Naukowe, 5(3), 159–175. Web.
Our history: Ray kroc & the McDonald’s Brothers. McDonald’s. (n.d.). Web.
Sekhon, A. K., & Kathuria, L. M. (2019). Analyzing the impact of corporate social responsibility on corporate financial performance: Evidence from top Indian firms. Corporate Governance: The International Journal of Business in Society, 20(1), 143–157. Web.
Simpson, F. (2022). McDonald’s to forge ahead with New Year changes in franchise policy despite requests for delay by franchisees. Forbes Magazine. Web.
Walker, J. R. (2022). The restaurant from concept to Operation. Wiley.