Introduction
Spectrophotometry is an extensively and incredibly useful biochemical assay. It is used to verify an absorbing species identification or estimate the amount of a certain analyte in solutions (Akash and Rehman, 2020). When light is transmitted through a solution, some of the incident light is absorbed by the solution’s constituents, and light scattering will also occur. The visible wavelength is 400-800 nm, corresponding to the visible light range. Some of the wavelengths of visible light are absorbed by colored substances. The light that they reflect is what provides them their visible color. A red compound, for instance, absorbs light in the blue/violet range of the spectral range and reflects red light (Berns, R. S., 2019). As a result, one can perceive it as a red color. As the concentration of absorbing substances in solution rises, so does the light intensity absorbed, and the visible color deepens.
A spectrophotometer is a spectroscopy instrument that analyzes light absorbed or transmitted, producing data used to determine the amount of an absorbing constituent. A researcher would first determine the absorption spectrum, which is a plot of absorbance vs. wavelength for this condition, while examining a solution of a colored compound (Kong et al., 2021). The wavelength of maximum absorption (λmax), at which the absorbance is highest, is a significant aspect of the absorption spectrum. According to the definition:
A = log (Io/I)
where: A = absorbance
Io= intensity of incident light
I = intensity of transmitted light
The Beer-Lambert equation scientifically explains the relationship between light absorption and the concentration of the species in solution.
A = ε.b.C
A is absorbance
C is the concentration
b is the path length of the cuvette
ε is the molar absorptivity
The hypothesis of this investigation was to employ the Beer-Lambert relationship to determine the maximum absorption of visible light by a green-colored solution of NiCl2(aq) and its corresponding concentration using spectrophotometry. The following are the objectives of the experiment:
- Learn how a spectrophotometer operates.
- Creating concentration-absorbance data for NiCl2(aq) using a virtual spectrophotometer.
- Generating a standard curve by plotting concentration-absorbance data to solve unknowns.
Methods and Materials
Materials and Equipment Used
Simulation spectrophotometer, cuvettes, ruler, distilled water, and NiCl2 from the benchtop.
Procedure
Using the Spectrophotometer to Find λmax
Navigated to web phet.colorado.edu to access the experiment. To launch the program, press the PLAY button, and there were two panels in the Beer’s Law Lab simulation. The “Concentration” game was on the first panel. One can modify the concentration by adding materials and water to the container. The next was “Beer’s Law” in the second panel. This would launch the simulation of a spectrophotometer’s interior. On display, one can see the various components of the spectrophotometer. Founded from the workstation the following; the light source, cross-section cuvette, a ruler, a meter, and benchtop where the content being tested can be selected and its concentration adjusted
On the benchtop, changed the solution taking cursor to NiCl2 instead of “drink mix.” A concentration of 100 mM (millimolar) was acceptable. A green solution was poured into the cuvette. Changed the spectrum fixation to “Variable” and began the wavelength at 780 nm by dragging the bar. Turned the meter to “Absorbance” and switched on the light by tapping the red on/off the tab. In the notes, made a table to record the wavelength and absorbance. Created a graph with absorbance on the y-axis and wavelength (nm) on the x-axis. The plot was evaluated to ensure that the value chosen for λmax corresponded to the curve.
Creating the Standard Curve
Return to the Beer’s Law simulation, choose the NiCl2 content, and make the cuvette width 1 cm. Set the wavelength to the λmax value discovered in the previous work. This spectrum was used to determine the absorption of a sequence of NiCl2(aq) solutions. The concentration of the solutions was provided in mM, or millimolar. Fixed the NiCl2 solution concentration to 0 mM and noted the absorbance of this solution. Then, added content to the cuvette in 25-mM increments and recorded absorbance for each until it reached 350 mM.
Recorded the data on the table in the spreadsheets notebook, with a set of absorbance values for 15 varying concentrations of NiCl2(aq) solution. Using the Excel spreadsheet, the following tasks were accomplished:
- Plotting the y-axis absorbance and the x-axis concentration;
- Drawing the ideal linear fit line for the data;
- Finding and reporting the value r2 3.
- Reporting the equation of the line as y = mx + b; displayed the equation on the graph.
- Express the line equation in Beer’s Law (i.e., replace y with A, m with ε.b, and x with C). If the equation of the line is y = 12x + 0.000, that meant that Beer’s Law line has y = A; slope 12 L/mmol = ε.b; and x = C, so would write A = 12,000 L/mol · C. In this simulation, b = 1 cm and C are in units of mM.
Results
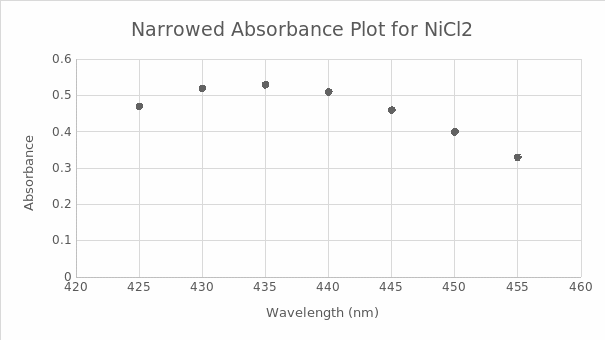
Table 1.1 shows the recorded data of the gross spectrum of the wavelength in nm as the unit used and absorbance. As shown on the right of the table, the data was narrowed for easier plotting of the absorbance-wavelength graph, as seen in figure 1.0. The wavelength of maximum absorption (λmax), at which the absorbance is highest, was 435 nm.

λmax=435 nm
Figure 1.0 shows the absorbance on the y-axis and wavelength (nm) on the x-axis, and λmax on the curve.
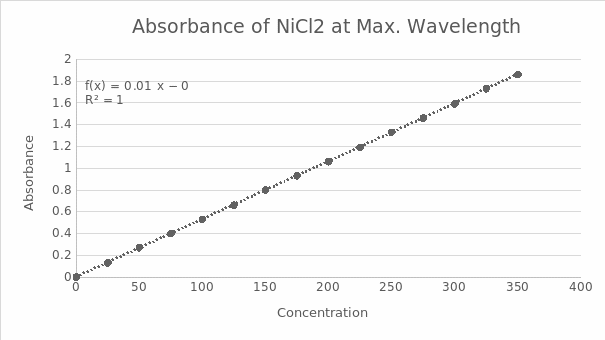
Table 1.2 shows the recorded concentration data in mM as the unit used and absorbance. The concentration begins at 0 mM because the line’s origin is always at (0,0), which is also required to determine its absorbance. Figure 2.0 shows the standard curve derived from table 1.2 to find out the r2 value = 0.999975598 and slope = 0.005311429.
Table 1.2 shows the recorded concentration and absorbance data

- r2value = 0.999975598
- slope = 0.005311429
Figure 2.0 shows the absorbance on the y-axis and concentration on the x-axis on the standard curve.
Table 1.3 showing worked problems as guide to the experiment using Beer-Lambert equation.
Discussion
Calculations
slope = 0.005311429
y = mx + b
A = ε.b.C
b = 1cm
ε.(1cm) = 0.005311429 L/mol
ε = 0.005311429 L/mol/1cm
ε = 0.005311429 L/mol.cm
A = ε.b.C
ε = 0.43 L/mol /80 mM × 1 cm
= 0.005375 L/mol.cm
Problem b
C = 0.75 L/mol/0.005375 L/mol.cm × 1 cm
= 139.53 mM
Problem c
A = 0.005375 L/mol.cm × 1 cm× 180 mM
= 0.97 L/mol
The maximum visible light absorption by a green-colored NiCl2(aq) solution was λmax = 435 nm. Since the absorption is greatest at about 435 nm, one’s understood that the NiCl2(aq) solution must be monitored at this wavelength. The concentration of the analyte is among the variable that affects its absorption spectrum. As a result, the absorbance is proportional to the concentration (Berns, R. S., 2019). The more substances in the path of the beam intensity, the greater the absorbance. As a result, path length and concentration are directly proportion.
Analyzed the Beer’s law interpretation and ensured that the equation A = ε.b.C conforms to a linear formula y = m.x. Realized that Beer’s law does not include a y-intercept because a concentration of zero colored substances results in absorption intensity of zero for pure water, the y-intercept should be zero (Kong et al., 2021). In the graphed standard curve, the slope of the line conforms to ε.b, while y represents absorbance and x represents concentration. The slope of the graph was used to determine the molar absorptivity(ε). The r2 value was satisfactory, and the curve graphically matched most data points. The standard curve’s effectiveness was used to determine the concentration of NiCl2(aq) from any measured absorbance.
Conclusion
The investigation’s hypothesis was achieved by employing the Beer-Lambert law to determine the maximum absorption of NiCl2(aq) and its corresponding concentrations. The lab’s objectives were also accomplished with the aid of the eco-friendly simulation spectrophotometer. In summary, spectrophotometry can determine the analyte present in a solution since each species has unique maximum absorption peaks. The standard curve can determine the concentration of unknown species in a solution.
References
Akash, M. S. H., & Rehman, K. (2020). Introduction to spectrophotometric techniques. In Essentials of pharmaceutical analysis (pp. 19-27). Springer, Singapore.
Berns, R. S. (2019). Billmeyer and Saltzman’s principles of color technology. John Wiley & Sons.
Kong, D., Zhao, J., Tang, S., Shen, W., & Lee, H. K. (2021). Logarithmic Data Processing Can Be Used Justifiably in the Plotting of a Calibration Curve. Analytical Chemistry, 93(36), 12156-12161.