For the benefit of the incoming administration, I submit this report to document, analyze, and interpret the macroeconomic policy decisions I made as the chief economic policy advisor of Econland. The purpose of this document is to further our national prosperity by deepening our understanding of the relationship between macroeconomic policies and their consequences for our citizens. The report includes a thorough accounting of the major fiscal and monetary policy decisions made over each of the seven years of my term, as well as an explanation of the underlying rationales for those decisions and the resulting impacts of those policies.
Table 1: Economic Environment, Decisions, and Results
The table above summarizes the macroeconomic climate of Econland over my term. As per the starting conditions during year zero, the economy approached the verge of stagnation and even deflation. This situation implied a decreased level of economic activity within the population. In other words, the existing cash flows did not allow for the GPD growth above average. For year zero, the actual rate of the GPD increase almost aligned with the global average: 2.5% and 2.4%, respectively. The unemployment level was also significant with 5.0% in this regard.
In order to promote the growth of the economy, a decision was made to raise the current interest rate. The three-year plan to promote and sustain this growth implied gradual development. More specifically, the initial decision to increase the interest rate encompassed both year one and year two with a subsequent increase planned for year three. This way, the economy was projected to have enough time to adjust to the new properties and reveal the profound benefits of the idea. One of the key expectations revolved around the decrease of unemployment, as well as the simultaneous growth of the GPD above the global average. Figure 1 provides the graphic representation of the data obtained in the course of the simulation.
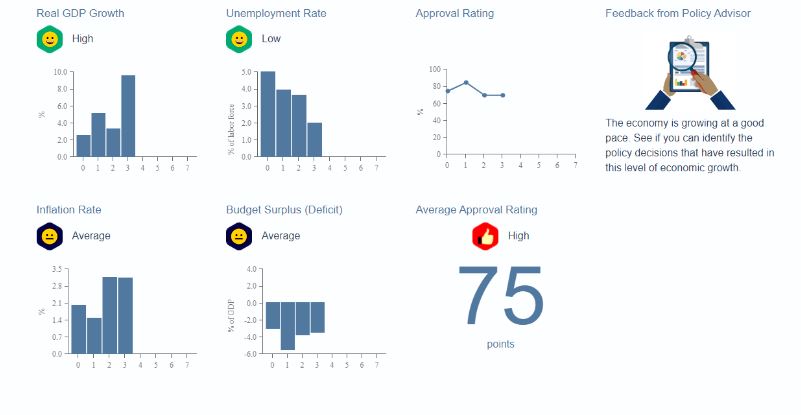
The outcome of the simulation fulfilled the expectations, meeting the criteria specified earlier. First, the interest rate was increased by 0.5 and amounted to 3.5% during years one and two, combined with a simultaneous tax decrease by 4% for both corporate entities and individuals. As a result, the first fiscal period saw a twofold increase in the GPD growth rate, from 2.5% to 5.1%, which also slowed the inflation. As per the simulation, these decisions intensified the activities within the economy. Apparently, the temporary tax cuts helped the labor marker regain its strength, as unemployment decreased to 3.9%. With the global average level remaining the same, such a growth became an indicator of the positive outcome of all changes made. A similar tendency was observed in year two, as employment continued to grow. This time, the inflation also increased, and so did the GDP. Even though the new growth rate was not as considerable as the year before, it still ranked considerably above the global average figure.
In year three, the next phase of the change plan was implemented, which marked the end of the temporary tax cuts. In fact, the income tax not only returned to the previous level but also surpassed by 1%, amounting to 25%. Simultaneously, the interest rate was once again raised by 0.5% to stimulate further economic activity. This stage resulted in the GDP growth by outstanding 9.5%, which allowed the economy to reduce its persistent budget deficit to -3.5%, which is nearly equal to the year-zero level. By the end of the simulation, the unemployment declined and finally amounted to 2%. Interestingly, the decisions that were made helped the consumer confidence index grow, attaining 102.6 by the final phase. Overall, the effects of such gradual, yet determined changes that combined the interests of both economy and consumers are positive. The GDP growth managed to surpass the average expectations, while the confidence of consumers provided an observable surge in employment.