Creating the environment in which the staff delivers the performance of the finest quality is a necessity for managers in the contemporary business environment (Groebner, Shannon, Fru, & Smith, 2014a). However, managing the staff and maintaining high motivation rates among the employees is a challenging task that requires a detailed analysis of the current situation and a good understanding of the needs of the company members.
First, a more detailed overview of the number of defects occurring in the course of the production process among the staff members will have to be carried out so that the further steps for defining the problems, enhancing the enthusiasm rates, and encouraging initiative could be outlined. Since the information regarding the number and the percentage of the defects in batches is provided on a regular basis, it can be used successfully to pinpoint the current performance of the staff and locate the emergent problems (Knell, 2014). To analyze the data, one should consider using the correlation plot, thus, connecting the number of incentives retrieved by the staff members with the number of defective items produced.
Table 1. Number of Defective Items Produced in Each Unit.
Table 2. Incentives Retrieved by the Employees in Each Unit (Average).
As the example provided above shows, the information retrieved in the course of the staff’s performance analysis allows locating the problems in their performance and, therefore, identifying the issues that cause a significant drop in the enthusiasm levels. As a result, a more detailed analysis of the subject matter will lead to the isolation of the factors that are likely to affect the employees in question positively. Particularly, the distribution of rewards and incentives provided to the staff members will be reconsidered and improved according to the data offered above.
The choice of the tools mentioned and applied above is quite obvious. The correlation analysis helps identify the connection between two factors and, thus, deliver the necessary information. One might argue that the application of the ANOVA test could be more beneficial to the outcomes of the analysis. Indeed, by definition, ANOVA allows dealing with non-numerical data, such as public appraisals, which are also considered as a type of reward. However, in the case in point, even non-numerical data was quantified. Therefore, there was no obvious need to include an overly complicated test instead of a more basic one (Groebner, Shannon, Fru, & Smith, 2014b).
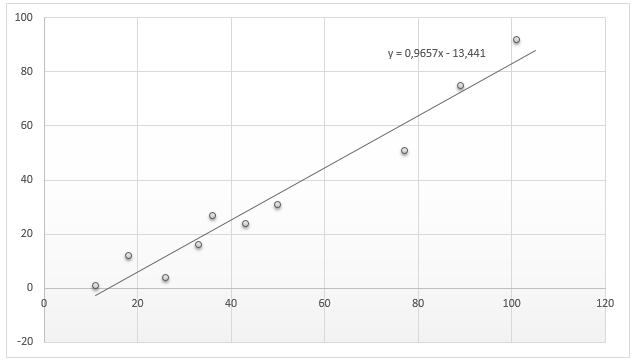
Another argument concerning the use of correlation and the subsequent application of the scatter plot concerns their forecasting properties. The trend line incorporated into the graph permits a clear overview of the current tendency and, therefore, serves as the premise for designing a future forecast. While admittedly isolated from the rest of the factors, including external ones, the scatter plot provided above makes it quite clear that there is a strong need in reconsidering the current approach toward the distribution of financial incentives as well as the policy of public appraisals (Boyhan, 2013).
Improving the quality of the staff’s performance is the primary task of the manager. Seeing that the identified characteristic is related closely to the use of both financial and social rewards, it is strongly suggested that a combination of both should be offered to the staff members. The correlation analysis carried out above, as well as the, scatter plot, make a very solid statement concerning the necessity of applying the specified measures in the target environment.
Reference List
Boyhan, G. (2013). Agricultural statistical data analysis using STATA. Chicago, IL: CRC Press.
Groebner, D. F., Shannon, P. W., Fru, P. C., & Smith, K. D. (2014a). Graphs, charts, and tables – describing your data. In Business statistics (9th ed.) (pp. 31-84). Upper Saddle River NJ: Prentice Hall.
Groebner, D. F., Shannon, P. W., Fru, P. C., & Smith, K. D. (2014b). Describing data using numerical measures. In Business statistics (9th ed.) (pp. 85-138). Upper Saddle River NJ: Prentice Hall.
Knell, R. (2014). Introductory R: A beginner’s guide to data visualisation, Statistical analysis and programming in R. New York, NY: Robert Knell.